Request█ OVERVIEW
This library is a tool for Pine Script™ programmers that consolidates access to a wide range of lesser-known data feeds available on TradingView, including metrics from the FRED database, FINRA short sale volume, open interest, and COT data. The functions in this library simplify requests for these data feeds, making them easier to retrieve and use in custom scripts.
█ CONCEPTS
Federal Reserve Economic Data (FRED)
FRED (Federal Reserve Economic Data) is a comprehensive online database curated by the Federal Reserve Bank of St. Louis. It provides free access to extensive economic and financial data from U.S. and international sources. FRED includes numerous economic indicators such as GDP, inflation, employment, and interest rates. Additionally, it provides financial market data, regional statistics, and international metrics such as exchange rates and trade balances.
Sourced from reputable organizations, including U.S. government agencies, international institutions, and other public and private entities, FRED enables users to analyze over 825,000 time series, download their data in various formats, and integrate their information into analytical tools and programming workflows.
On TradingView, FRED data is available from ticker identifiers with the "FRED:" prefix. Users can search for FRED symbols in the "Symbol Search" window, and Pine scripts can retrieve data for these symbols via `request.*()` function calls.
FINRA Short Sale Volume
FINRA (the Financial Industry Regulatory Authority) is a non-governmental organization that supervises and regulates U.S. broker-dealers and securities professionals. Its primary aim is to protect investors and ensure integrity and transparency in financial markets.
FINRA's Short Sale Volume data provides detailed information about daily short-selling activity across U.S. equity markets. This data tracks the volume of short sales reported to FINRA's trade reporting facilities (TRFs), including shares sold on FINRA-regulated Alternative Trading Systems (ATSs) and over-the-counter (OTC) markets, offering transparent access to short-selling information not typically available from exchanges. This data helps market participants, researchers, and regulators monitor trends in short-selling and gain insights into bearish sentiment, hedging strategies, and potential market manipulation. Investors often use this data alongside other metrics to assess stock performance, liquidity, and overall trading activity.
It is important to note that FINRA's Short Sale Volume data does not consolidate short sale information from public exchanges and excludes trading activity that is not publicly disseminated.
TradingView provides ticker identifiers for requesting Short Sale Volume data with the format "FINRA:_SHORT_VOLUME", where "" is a supported U.S. equities symbol (e.g., "AAPL").
Open Interest (OI)
Open interest is a cornerstone indicator of market activity and sentiment in derivatives markets such as options or futures. In contrast to volume, which measures the number of contracts opened or closed within a period, OI measures the number of outstanding contracts that are not yet settled. This distinction makes OI a more robust indicator of how money flows through derivatives, offering meaningful insights into liquidity, market interest, and trends. Many traders and investors analyze OI alongside volume and price action to gain an enhanced perspective on market dynamics and reinforce trading decisions.
TradingView offers many ticker identifiers for requesting OI data with the format "_OI", where "" represents a derivative instrument's ticker ID (e.g., "COMEX:GC1!").
Commitment of Traders (COT)
Commitment of Traders data provides an informative weekly breakdown of the aggregate positions held by various market participants, including commercial hedgers, non-commercial speculators, and small traders, in the U.S. derivative markets. Tallied and managed by the Commodity Futures Trading Commission (CFTC) , these reports provide traders and analysts with detailed insight into an asset's open interest and help them assess the actions of various market players. COT data is valuable for gaining a deeper understanding of market dynamics, sentiment, trends, and liquidity, which helps traders develop informed trading strategies.
TradingView has numerous ticker identifiers that provide access to time series containing data for various COT metrics. To learn about COT ticker IDs and how they work, see our LibraryCOT publication.
█ USING THE LIBRARY
Common function characteristics
• This library's functions construct ticker IDs with valid formats based on their specified parameters, then use them as the `symbol` argument in request.security() to retrieve data from the specified context.
• Most of these functions automatically select the timeframe of a data request because the data feeds are not available for all timeframes.
• All the functions have two overloads. The first overload of each function uses values with the "simple" qualifier to define the requested context, meaning the context does not change after the first script execution. The second accepts "series" values, meaning it can request data from different contexts across executions.
• The `gaps` parameter in most of these functions specifies whether the returned data is `na` when a new value is unavailable for request. By default, its value is `false`, meaning the call returns the last retrieved data when no new data is available.
• The `repaint` parameter in applicable functions determines whether the request can fetch the latest unconfirmed values from a higher timeframe on realtime bars, which might repaint after the script restarts. If `false`, the function only returns confirmed higher-timeframe values to avoid repainting. The default value is `true`.
`fred()`
The `fred()` function retrieves the most recent value of a specified series from the Federal Reserve Economic Data (FRED) database. With this function, programmers can easily fetch macroeconomic indicators, such as GDP and unemployment rates, and use them directly in their scripts.
How it works
The function's `fredCode` parameter accepts a "string" representing the unique identifier of a specific FRED series. Examples include "GDP" for the "Gross Domestic Product" series and "UNRATE" for the "Unemployment Rate" series. Over 825,000 codes are available. To access codes for available series, search the FRED website .
The function adds the "FRED:" prefix to the specified `fredCode` to construct a valid FRED ticker ID (e.g., "FRED:GDP"), which it uses in request.security() to retrieve the series data.
Example Usage
This line of code requests the latest value from the Gross Domestic Product series and assigns the returned value to a `gdpValue` variable:
float gdpValue = fred("GDP")
`finraShortSaleVolume()`
The `finraShortSaleVolume()` function retrieves EOD data from a FINRA Short Sale Volume series. Programmers can call this function to retrieve short-selling information for equities listed on supported exchanges, namely NASDAQ, NYSE, and NYSE ARCA.
How it works
The `symbol` parameter determines which symbol's short sale volume information is retrieved by the function. If the value is na , the function requests short sale volume data for the chart's symbol. The argument can be the name of the symbol from a supported exchange (e.g., "AAPL") or a ticker ID with an exchange prefix ("NASDAQ:AAPL"). If the `symbol` contains an exchange prefix, it must be one of the following: "NASDAQ", "NYSE", "AMEX", or "BATS".
The function constructs a ticker ID in the format "FINRA:ticker_SHORT_VOLUME", where "ticker" is the symbol name without the exchange prefix (e.g., "AAPL"). It then uses the ticker ID in request.security() to retrieve the available data.
Example Usage
This line of code retrieves short sale volume for the chart's symbol and assigns the result to a `shortVolume` variable:
float shortVolume = finraShortSaleVolume(syminfo.tickerid)
This example requests short sale volume for the "NASDAQ:AAPL" symbol, irrespective of the current chart:
float shortVolume = finraShortSaleVolume("NASDAQ:AAPL")
`openInterestFutures()` and `openInterestCrypto()`
The `openInterestFutures()` function retrieves EOD open interest (OI) data for futures contracts. The `openInterestCrypto()` function provides more granular OI data for cryptocurrency contracts.
How they work
The `openInterestFutures()` function retrieves EOD closing OI information. Its design is focused primarily on retrieving OI data for futures, as only EOD OI data is available for these instruments. If the chart uses an intraday timeframe, the function requests data from the "1D" timeframe. Otherwise, it uses the chart's timeframe.
The `openInterestCrypto()` function retrieves opening, high, low, and closing OI data for a cryptocurrency contract on a specified timeframe. Unlike `openInterest()`, this function can also retrieve granular data from intraday timeframes.
Both functions contain a `symbol` parameter that determines the symbol for which the calls request OI data. The functions construct a valid OI ticker ID from the chosen symbol by appending "_OI" to the end (e.g., "CME:ES1!_OI").
The `openInterestFutures()` function requests and returns a two-element tuple containing the futures instrument's EOD closing OI and a "bool" condition indicating whether OI is rising.
The `openInterestCrypto()` function requests and returns a five-element tuple containing the cryptocurrency contract's opening, high, low, and closing OI, and a "bool" condition indicating whether OI is rising.
Example usage
This code line calls `openInterest()` to retrieve EOD OI and the OI rising condition for a futures symbol on the chart, assigning the values to two variables in a tuple:
= openInterestFutures(syminfo.tickerid)
This line retrieves the EOD OI data for "CME:ES1!", irrespective of the current chart's symbol:
= openInterestFutures("CME:ES1!")
This example uses `openInterestCrypto()` to retrieve OHLC OI data and the OI rising condition for a cryptocurrency contract on the chart, sampled at the chart's timeframe. It assigns the returned values to five variables in a tuple:
= openInterestCrypto(syminfo.tickerid, timeframe.period)
This call retrieves OI OHLC and rising information for "BINANCE:BTCUSDT.P" on the "1D" timeframe:
= openInterestCrypto("BINANCE:BTCUSDT.P", "1D")
`commitmentOfTraders()`
The `commitmentOfTraders()` function retrieves data from the Commitment of Traders (COT) reports published by the Commodity Futures Trading Commission (CFTC). This function significantly simplifies the COT request process, making it easier for programmers to access and utilize the available data.
How It Works
This function's parameters determine different parts of a valid ticker ID for retrieving COT data, offering a streamlined alternative to constructing complex COT ticker IDs manually. The `metricName`, `metricDirection`, and `includeOptions` parameters are required. They specify the name of the reported metric, the direction, and whether it includes information from options contracts.
The function also includes several optional parameters. The `CFTCCode` parameter allows programmers to request data for a specific report code. If unspecified, the function requests data based on the chart symbol's root prefix, base currency, or quoted currency, depending on the `mode` argument. The call can specify the report type ("Legacy", "Disaggregated", or "Financial") and metric type ("All", "Old", or "Other") with the `typeCOT` and `metricType` parameters.
Explore the CFTC website to find valid report codes for specific assets. To find detailed information about the metrics included in the reports and their meanings, see the CFTC's Explanatory Notes .
View the function's documentation below for detailed explanations of its parameters. For in-depth information about COT ticker IDs and more advanced functionality, refer to our previously published COT library .
Available metrics
Different COT report types provide different metrics . The tables below list all available metrics for each type and their applicable directions:
+------------------------------+------------------------+
| Legacy (COT) Metric Names | Directions |
+------------------------------+------------------------+
| Open Interest | No direction |
| Noncommercial Positions | Long, Short, Spreading |
| Commercial Positions | Long, Short |
| Total Reportable Positions | Long, Short |
| Nonreportable Positions | Long, Short |
| Traders Total | No direction |
| Traders Noncommercial | Long, Short, Spreading |
| Traders Commercial | Long, Short |
| Traders Total Reportable | Long, Short |
| Concentration Gross LT 4 TDR | Long, Short |
| Concentration Gross LT 8 TDR | Long, Short |
| Concentration Net LT 4 TDR | Long, Short |
| Concentration Net LT 8 TDR | Long, Short |
+------------------------------+------------------------+
+-----------------------------------+------------------------+
| Disaggregated (COT2) Metric Names | Directions |
+-----------------------------------+------------------------+
| Open Interest | No Direction |
| Producer Merchant Positions | Long, Short |
| Swap Positions | Long, Short, Spreading |
| Managed Money Positions | Long, Short, Spreading |
| Other Reportable Positions | Long, Short, Spreading |
| Total Reportable Positions | Long, Short |
| Nonreportable Positions | Long, Short |
| Traders Total | No Direction |
| Traders Producer Merchant | Long, Short |
| Traders Swap | Long, Short, Spreading |
| Traders Managed Money | Long, Short, Spreading |
| Traders Other Reportable | Long, Short, Spreading |
| Traders Total Reportable | Long, Short |
| Concentration Gross LE 4 TDR | Long, Short |
| Concentration Gross LE 8 TDR | Long, Short |
| Concentration Net LE 4 TDR | Long, Short |
| Concentration Net LE 8 TDR | Long, Short |
+-----------------------------------+------------------------+
+-------------------------------+------------------------+
| Financial (COT3) Metric Names | Directions |
+-------------------------------+------------------------+
| Open Interest | No Direction |
| Dealer Positions | Long, Short, Spreading |
| Asset Manager Positions | Long, Short, Spreading |
| Leveraged Funds Positions | Long, Short, Spreading |
| Other Reportable Positions | Long, Short, Spreading |
| Total Reportable Positions | Long, Short |
| Nonreportable Positions | Long, Short |
| Traders Total | No Direction |
| Traders Dealer | Long, Short, Spreading |
| Traders Asset Manager | Long, Short, Spreading |
| Traders Leveraged Funds | Long, Short, Spreading |
| Traders Other Reportable | Long, Short, Spreading |
| Traders Total Reportable | Long, Short |
| Concentration Gross LE 4 TDR | Long, Short |
| Concentration Gross LE 8 TDR | Long, Short |
| Concentration Net LE 4 TDR | Long, Short |
| Concentration Net LE 8 TDR | Long, Short |
+-------------------------------+------------------------+
Example usage
This code line retrieves "Noncommercial Positions (Long)" data, without options information, from the "Legacy" report for the chart symbol's root, base currency, or quote currency:
float nonCommercialLong = commitmentOfTraders("Noncommercial Positions", "Long", false)
This example retrieves "Managed Money Positions (Short)" data, with options included, from the "Disaggregated" report:
float disaggregatedData = commitmentOfTraders("Managed Money Positions", "Short", true, "", "Disaggregated")
█ NOTES
• This library uses dynamic requests , allowing dynamic ("series") arguments for the parameters defining the context (ticker ID, timeframe, etc.) of a `request.*()` function call. With this feature, a single `request.*()` call instance can flexibly retrieve data from different feeds across historical executions. Additionally, scripts can use such calls in the local scopes of loops, conditional structures, and even exported library functions, as demonstrated in this script. All scripts coded in Pine Script™ v6 have dynamic requests enabled by default. To learn more about the behaviors and limitations of this feature, see the Dynamic requests section of the Pine Script™ User Manual.
• The library's example code offers a simple demonstration of the exported functions. The script retrieves available data using the function specified by the "Series type" input. The code requests a FRED series or COT (Legacy), FINRA Short Sale Volume, or Open Interest series for the chart's symbol with specific parameters, then plots the retrieved data as a step-line with diamond markers.
Look first. Then leap.
█ EXPORTED FUNCTIONS
This library exports the following functions:
fred(fredCode, gaps)
Requests a value from a specified Federal Reserve Economic Data (FRED) series. FRED is a comprehensive source that hosts numerous U.S. economic datasets. To explore available FRED datasets and codes, search for specific categories or keywords at fred.stlouisfed.org Calls to this function count toward a script's `request.*()` call limit.
Parameters:
fredCode (series string) : The unique identifier of the FRED series. The function uses the value to create a valid ticker ID for retrieving FRED data in the format `"FRED:fredCode"`. For example, `"GDP"` refers to the "Gross Domestic Product" series ("FRED:GDP"), and `"GFDEBTN"` refers to the "Federal Debt: Total Public Debt" series ("FRED:GFDEBTN").
gaps (simple bool) : Optional. If `true`, the function returns a non-na value only when a new value is available from the requested context. If `false`, the function returns the latest retrieved value when new data is unavailable. The default is `false`.
Returns: (float) The value from the requested FRED series.
finraShortSaleVolume(symbol, gaps, repaint)
Requests FINRA daily short sale volume data for a specified symbol from one of the following exchanges: NASDAQ, NYSE, NYSE ARCA. If the chart uses an intraday timeframe, the function requests data from the "1D" timeframe. Otherwise, it uses the chart's timeframe. Calls to this function count toward a script's `request.*()` call limit.
Parameters:
symbol (series string) : The symbol for which to request short sale volume data. If the specified value contains an exchange prefix, it must be one of the following: "NASDAQ", "NYSE", "AMEX", "BATS".
gaps (simple bool) : Optional. If `true`, the function returns a non-na value only when a new value is available from the requested context. If `false`, the function returns the latest retrieved value when new data is unavailable. The default is `false`.
repaint (simple bool) : Optional. If `true` and the chart's timeframe is intraday, the value requested on realtime bars may change its time offset after the script restarts its executions. If `false`, the function returns the last confirmed period's values to avoid repainting. The default is `true`.
Returns: (float) The short sale volume for the specified symbol or the chart's symbol.
openInterestFutures(symbol, gaps, repaint)
Requests EOD open interest (OI) and OI rising information for a valid futures symbol. If the chart uses an intraday timeframe, the function requests data from the "1D" timeframe. Otherwise, it uses the chart's timeframe. Calls to this function count toward a script's `request.*()` call limit.
Parameters:
symbol (series string) : The symbol for which to request open interest data.
gaps (simple bool) : Optional. If `true`, the function returns non-na values only when new values are available from the requested context. If `false`, the function returns the latest retrieved values when new data is unavailable. The default is `false`.
repaint (simple bool) : Optional. If `true` and the chart's timeframe is intraday, the value requested on realtime bars may change its time offset after the script restarts its executions. If `false`, the function returns the last confirmed period's values to avoid repainting. The default is `true`.
Returns: ( ) A tuple containing the following values:
- The closing OI value for the symbol.
- `true` if the closing OI is above the previous period's value, `false` otherwise.
openInterestCrypto(symbol, timeframe, gaps, repaint)
Requests opening, high, low, and closing open interest (OI) data and OI rising information for a valid cryptocurrency contract on a specified timeframe. Calls to this function count toward a script's `request.*()` call limit.
Parameters:
symbol (series string) : The symbol for which to request open interest data.
timeframe (series string) : The timeframe of the data request. If the timeframe is lower than the chart's timeframe, it causes a runtime error.
gaps (simple bool) : Optional. If `true`, the function returns non-na values only when new values are available from the requested context. If `false`, the function returns the latest retrieved values when new data is unavailable. The default is `false`.
repaint (simple bool) : Optional. If `true` and the `timeframe` represents a higher timeframe, the function returns unconfirmed values from the timeframe on realtime bars, which repaint when the script restarts its executions. If `false`, it returns only confirmed higher-timeframe values to avoid repainting. The default is `true`.
Returns: ( ) A tuple containing the following values:
- The opening, high, low, and closing OI values for the symbol, respectively.
- `true` if the closing OI is above the previous period's value, `false` otherwise.
commitmentOfTraders(metricName, metricDirection, includeOptions, CFTCCode, typeCOT, mode, metricType)
Requests Commitment of Traders (COT) data with specified parameters. This function provides a simplified way to access CFTC COT data available on TradingView. Calls to this function count toward a script's `request.*()` call limit. For more advanced tools and detailed information about COT data, see TradingView's LibraryCOT library.
Parameters:
metricName (series string) : One of the valid metric names listed in the library's documentation and source code.
metricDirection (series string) : Metric direction. Possible values are: "Long", "Short", "Spreading", and "No direction". Consult the library's documentation or code to see which direction values apply to the specified metric.
includeOptions (series bool) : If `true`, the COT symbol includes options information. Otherwise, it does not.
CFTCCode (series string) : Optional. The CFTC code for the asset. For example, wheat futures (root "ZW") have the code "001602". If one is not specified, the function will attempt to get a valid code for the chart symbol's root, base currency, or main currency.
typeCOT (series string) : Optional. The type of report to request. Possible values are: "Legacy", "Disaggregated", "Financial". The default is "Legacy".
mode (series string) : Optional. Specifies the information the function extracts from a symbol. Possible modes are:
- "Root": The function extracts the futures symbol's root prefix information (e.g., "ES" for "ESH2020").
- "Base currency": The function extracts the first currency from a currency pair (e.g., "EUR" for "EURUSD").
- "Currency": The function extracts the currency of the symbol's quoted values (e.g., "JPY" for "TSE:9984" or "USDJPY").
- "Auto": The function tries the first three modes (Root -> Base currency -> Currency) until it finds a match.
The default is "Auto". If the specified mode is not available for the symbol, it causes a runtime error.
metricType (series string) : Optional. The metric type. Possible values are: "All", "Old", "Other". The default is "All".
Returns: (float) The specified Commitment of Traders data series. If no data is available, it causes a runtime error.
Cerca negli script per "the script"

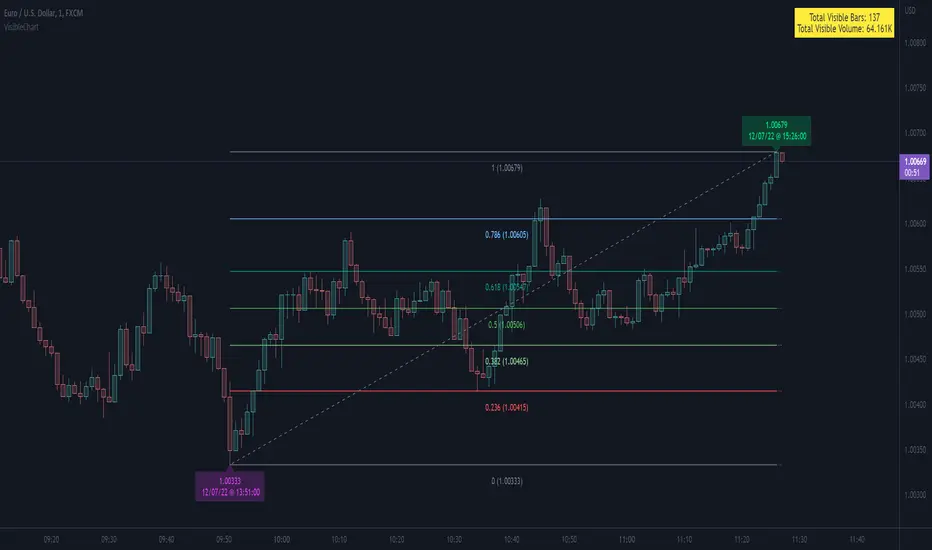
VisibleChart█ OVERVIEW
This library is a Pine programmer’s tool containing functions that return values calculated from the range of visible bars on the chart.
This is now possible in Pine Script™ thanks to the recently-released chart.left_visible_bar_time and chart.right_visible_bar_time built-ins, which return the opening time of the leftmost and rightmost bars on the chart. These values update as traders scroll or zoom their charts, which gives way to a class of indicators that can dynamically recalculate and draw visuals on visible bars only, as users scroll or zoom their charts. We hope this library's functions help you make the most of the world of possibilities these new built-ins provide for Pine scripts.
For an example of a script using this library, have a look at the Chart VWAP indicator.
█ CONCEPTS
Chart properties
The new chart.left_visible_bar_time and chart.right_visible_bar_time variables return the opening time of the leftmost and rightmost bars on the chart. They are only two of many new built-ins in the `chart.*` namespace. See this blog post for more information, or look them up by typing "chart." in the Pine Script™ Reference Manual .
Dynamic recalculation of scripts on visible bars
Any script using chart.left_visible_bar_time or chart.right_visible_bar_time acquires a unique property, which triggers its recalculation when traders scroll or zoom their charts in such a way that the range of visible bars on the chart changes. This library's functions use the two recent built-ins to derive various values from the range of visible bars.
Designing your scripts for dynamic recalculation
For the library's functions to work correctly, they must be called on every bar. For reliable results, assign their results to global variables and then use the variables locally where needed — not the raw function calls.
Some functions like `barIsVisible()` or `open()` will return a value starting on the leftmost visible bar. Others such as `high()` or `low()` will also return a value starting on the leftmost visible bar, but their correct value can only be known on the rightmost visible bar, after all visible bars have been analyzed by the script.
You can plot values as the script executes on visible bars, but efficient code will, when possible, create resource-intensive labels, lines or tables only once in the global scope using var , and then use the setter functions to modify their properties on the last bar only. The example code included in this library uses this method.
Keep in mind that when your script uses chart.left_visible_bar_time or chart.right_visible_bar_time , your script will recalculate on all bars each time the user scrolls or zooms their chart. To provide script users with the best experience you should strive to keep calculations to a minimum and use efficient code so that traders are not always waiting for your script to recalculate every time they scroll or zoom their chart.
Another aspect to consider is the fact that the rightmost visible bar will not always be the last bar in the dataset. When script users scroll back in time, a large portion of the time series the script calculates on may be situated after the rightmost visible bar. We can never assume the rightmost visible bar is also the last bar of the time series. Use `barIsVisible()` to restrict calculations to visible bars, but also consider that your script can continue to execute past them.
Look first. Then leap.
█ FUNCTIONS
The library contains the following functions:
barIsVisible()
Condition to determine if a given bar is within the users visible time range.
Returns: (bool) True if the the calling bar is between the `chart.left_visible_bar_time` and the `chart.right_visible_bar_time`.
high()
Determines the value of the highest `high` in visible bars.
Returns: (float) The maximum high value of visible chart bars.
highBarIndex()
Determines the `bar_index` of the highest `high` in visible bars.
Returns: (int) The `bar_index` of the `high()`.
highBarTime()
Determines the bar time of the highest `high` in visible bars.
Returns: (int) The `time` of the `high()`.
low()
Determines the value of the lowest `low` in visible bars.
Returns: (float) The minimum low value of visible chart bars.
lowBarIndex()
Determines the `bar_index` of the lowest `low` in visible bars.
Returns: (int) The `bar_index` of the `low()`.
lowBarTime()
Determines the bar time of the lowest `low` in visible bars.
Returns: (int) The `time` of the `low()`.
open()
Determines the value of the opening price in the visible chart time range.
Returns: (float) The `open` of the leftmost visible chart bar.
close()
Determines the value of the closing price in the visible chart time range.
Returns: (float) The `close` of the rightmost visible chart bar.
leftBarIndex()
Determines the `bar_index` of the leftmost visible chart bar.
Returns: (int) A `bar_index`.
rightBarIndex()
Determines the `bar_index` of the rightmost visible chart bar.
Returns: (int) A `bar_index`
bars()
Determines the number of visible chart bars.
Returns: (int) The number of bars.
volume()
Determines the sum of volume of all visible chart bars.
Returns: (float) The cumulative sum of volume.
ohlcv()
Determines the open, high, low, close, and volume sum of the visible bar time range.
Returns: ( ) A tuple of the OHLCV values for the visible chart bars. Example: open is chart left, high is the highest visible high, etc.
chartYPct(pct)
Determines a price level as a percentage of the visible bar price range, which depends on the chart's top/bottom margins in "Settings/Appearance".
Parameters:
pct : (series float) Percentage of the visible price range (50 is 50%). Negative values are allowed.
Returns: (float) A price level equal to the `pct` of the price range between the high and low of visible chart bars. Example: 50 is halfway between the visible high and low.
chartXTimePct(pct)
Determines a time as a percentage of the visible bar time range.
Parameters:
pct : (series float) Percentage of the visible time range (50 is 50%). Negative values are allowed.
Returns: (float) A time in UNIX format equal to the `pct` of the time range from the `chart.left_visible_bar_time` to the `chart.right_visible_bar_time`. Example: 50 is halfway from the leftmost visible bar to the rightmost.
chartXIndexPct(pct)
Determines a `bar_index` as a percentage of the visible bar time range.
Parameters:
pct : (series float) Percentage of the visible time range (50 is 50%). Negative values are allowed.
Returns: (float) A time in UNIX format equal to the `pct` of the time range from the `chart.left_visible_bar_time` to the `chart.right_visible_bar_time`. Example: 50 is halfway from the leftmost visible bar to the rightmost.
whenVisible(src, whenCond, length)
Creates an array containing the `length` last `src` values where `whenCond` is true for visible chart bars.
Parameters:
src : (series int/float) The source of the values to be included.
whenCond : (series bool) The condition determining which values are included. Optional. The default is `true`.
length : (simple int) The number of last values to return. Optional. The default is all values.
Returns: (float ) The array ID of the accumulated `src` values.
avg(src)
Gathers values of the source over visible chart bars and averages them.
Parameters:
src : (series int/float) The source of the values to be averaged. Optional. Default is `close`.
Returns: (float) A cumulative average of values for the visible time range.
median(src)
Calculates the median of a source over visible chart bars.
Parameters:
src : (series int/float) The source of the values. Optional. Default is `close`.
Returns: (float) The median of the `src` for the visible time range.
vVwap(src)
Calculates a volume-weighted average for visible chart bars.
Parameters:
src : (series int/float) Source used for the VWAP calculation. Optional. Default is `hlc3`.
Returns: (float) The VWAP for the visible time range.
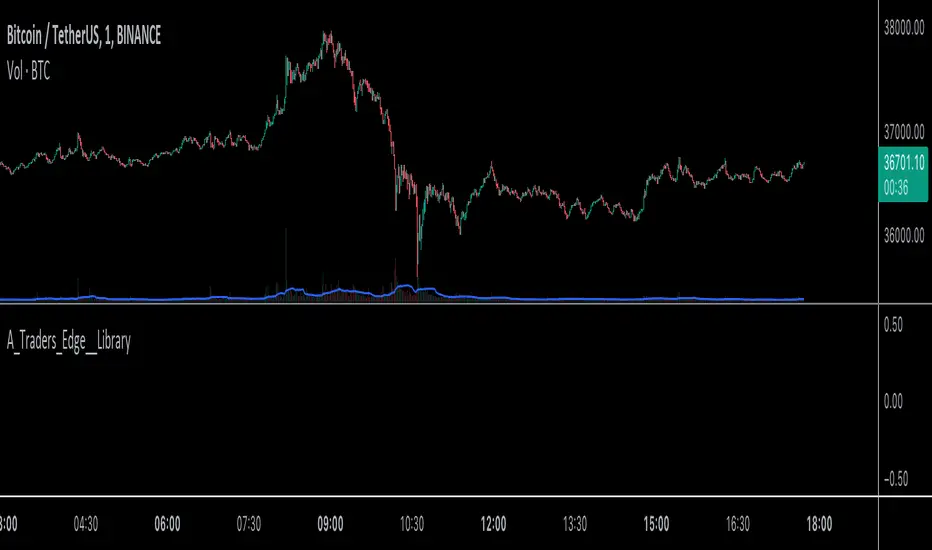
A_Traders_Edge__LibraryLibrary "A_Traders_Edge__Library"
- A Trader's Edge (ATE)_Library was created to assist in constructing Market Overview Scanners (MOS)
LabelLocation(_firstLocation)
This function is used when there's a desire to print an assets ALERT LABELS at a set location on the scale that will
NOT change throughout the progression of the script. This is created so that if a lot of alerts are triggered, they
will stay relatively visible and not overlap each other. Ex. If you set your '_firstLocation' parameter as 1, since
there are a max of 40 assets that can be scanned, the 1st asset's location is assigned the value in the '_firstLocation' parameter,
the 2nd asset's location is the (1st asset's location+1)...and so on. If your first location is set to 81 then
the 1st asset is 81 and 2nd is 82 and so on until the 40th location = 120(in this particular example).
Parameters:
_firstLocation (simple int) : (simple int)
Optional(starts at 1 if no parameter added).
Location that you want the first asset to print its label if is triggered to do so.
ie. loc2=loc1+1, loc3=loc2+1, etc.
Returns: Returns 40 output variables each being a different location to print the labels so that an asset is asssigned to
a particular location on the scale. Regardless of if you have the maximum amount of assets being screened (40 max), this
function will output 40 locations… So there needs to be 40 variables assigned in the tuple in this function. What I
mean by that is you need to have 40 output location variables within your tuple (ie. between the ' ') regarless of
if your scanning 40 assets or not. If you only have 20 assets in your scripts input settings, then only the first 20
variables within the ' ' Will be assigned to a value location and the other 20 will be assigned 'NA', but their
variables still need to be present in the tuple.
SeparateTickerids(_string)
You must form this single tickerID input string exactly as described in the scripts info panel (little gray 'i' that
is circled at the end of the settings in the settings/input panel that you can hover your cursor over this 'i' to read the
details of that particular input). IF the string is formed correctly then it will break up this single string parameter into
a total of 40 separate strings which will be all of the tickerIDs that the script is using in your MO scanner.
Parameters:
_string (simple string) : (string)
A maximum of 40 Tickers (ALL joined as 1 string for the input parameter) that is formulated EXACTLY as described
within the tooltips of the TickerID inputs in my MOS Scanner scripts:
assets = input.text_area(tIDset1, title="TickerID (MUST READ TOOLTIP)", tooltip="Accepts 40 TICKERID's for each
copy of the script on the chart. TEXT FORMATTING RULES FOR TICKERID'S:
(1) To exclude the EXCHANGE NAME in the Labels, de-select the next input option.
(2) MUST have a space (' ') AFTER each TickerID.
(3) Capitalization in the Labels will match cap of these TickerID's.
(4) If your asset has a BaseCurrency & QuoteCurrency (ie. ADAUSDT ) BUT you ONLY want Labels
to show BaseCurrency(ie.'ADA'), include a FORWARD SLASH ('/') between the Base & Quote (ie.'ADA/USDT')", display=display.none)
Returns: Returns 40 output variables of the different strings of TickerID's (ie. you need to output 40 variables within the
tuple ' ' regardless of if you were scanning using all possible (40) assets or not.
If your scanning for less than 40 assets, then once the variables are assigned to all of the tickerIDs, the rest
of the 40 variables in the tuple will be assigned "NA".
TickeridForLabelsAndSecurity(_includeExchange, _ticker)
This function accepts the TickerID Name as its parameter and produces a single string that will be used in all of your labels.
Parameters:
_includeExchange (simple bool) : (bool)
Optional(if parameter not included in function it defaults to false ).
Used to determine if the Exchange name will be included in all labels/triggers/alerts.
_ticker (simple string) : (string)
For this parameter, input the varible named '_coin' from your 'f_main()' function for this parameter. It is the raw
Ticker ID name that will be processed.
Returns: ( )
Returns 2 output variables:
1st ('_securityTickerid') is to be used in the 'request.security()' function as this string will contain everything
TV needs to pull the correct assets data.
2nd ('lblTicker') is to be used in all of the labels in your MOS as it will only contain what you want your labels
to show as determined by how the tickerID is formulated in the MOS's input.
InvalidTID(_tablePosition, _stackVertical, _close, _securityTickerid, _invalidArray)
This is to add a table in the middle right of your chart that prints all the TickerID's that were either not formulated
correctly in the '_source' input or that is not a valid symbol and should be changed.
Parameters:
_tablePosition (simple string) : (string)
Optional(if parameter not included, it defaults to position.middle_right). Location on the chart you want the table printed.
Possible strings include: position.top_center, position.top_left, position.top_right, position.middle_center,
position.middle_left, position.middle_right, position.bottom_center, position.bottom_left, position.bottom_right.
_stackVertical (simple bool) : (bool)
Optional(if parameter not included, it defaults to true). All of the assets that are counted as INVALID will be
created in a list. If you want this list to be prited as a column then input 'true' here.
_close (float) : (float)
If you want them printed as a single row then input 'false' here.
This should be the closing value of each of the assets being tested to determine in the TickerID is valid or not.
_securityTickerid (string) : (string)
Throughout the entire charts updates, if a '_close' value is never regestered then the logic counts the asset as INVALID.
This will be the 1st TickerID varible (named _securityTickerid) outputted from the tuple of the TickeridForLabels()
function above this one.
_invalidArray (string ) : (array string)
Input the array from the original script that houses all of the invalidArray strings.
Returns: (na)
Returns a table with the screened assets Invalid TickerID's. Table draws automatically if any are Invalid, thus,
no output variable to deal with.
LabelSizes(_barCnt, _lblSzRfrnce)
This function sizes your Alert Trigger Labels according to the amount of Printed Bars the chart has printed within
a set time period, while also keeping in mind the smallest relative reference size you input in the 'lblSzRfrnceInput'
parameter of this function. A HIGHER % of Printed Bars(aka...more trades occurring for that asset on the exchange),
the LARGER the Name Label will print, potentially showing you the better opportunities on the exchange to avoid
exchange manipulation liquidations.
*** SHOULD NOT be used as size of labels that are your asset Name Labels next to each asset's Line Plot...
if your MOS includes these as you want these to be the same size for every asset so the larger ones dont cover the
smaller ones if the plots are all close to each other ***
Parameters:
_barCnt (float) : (float)
Get the 1st variable('barCnt') from the 'PrintedBarCount' function's tuple and input it as this functions 1st input
parameter which will directly affect the size of the 2nd output variable ('alertTrigLabel') outputted by this function.
_lblSzRfrnce (string) : (string)
Optional(if parameter not included, it defaults to size.small). This will be the size of the 1st variable outputted
by this function ('assetNameLabel') BUT also affects the 2nd variable outputted by this function.
Returns: ( )
Returns 2 variables:
1st output variable ('AssetNameLabel') is assigned to the size of the 'lblSzRfrnceInput' parameter.
2nd output variable('alertTrigLabel') can be of variying sizes depending on the 'barCnt' parameter...BUT the smallest
size possible for the 2nd output variable ('alertTrigLabel') will be the size set in the 'lblSzRfrnceInput' parameter.
AssetColor()
This function is used to assign 40 different colors to 40 variables to be used for the different labels/plots.
Returns: Returns 40 output variables each with a different color assigned to them to be used in your plots & labels.
Regardless of if you have the maximum amount of assets your scanning(40 max) or less,
this function will assign 40 colors to 40 variables that you have between the ' '.
PrintedBarCount(_time, _barCntLength, _barCntPercentMin)
The Printed BarCount Filter looks back a User Defined amount of minutes and calculates the % of bars that have printed
out of the TOTAL amount of bars that COULD HAVE been printed within the same amount of time.
Parameters:
_time (int) : (int)
The time associated with the chart of the particular asset that is being screened at that point.
_barCntLength (int) : (int)
The amount of time (IN MINUTES) that you want the logic to look back at to calculate the % of bars that have actually
printed in the span of time you input into this parameter.
_barCntPercentMin (int) : (int)
The minimum % of Printed Bars of the asset being screened has to be GREATER than the value set in this parameter
for the output variable 'bc_gtg' to be true.
Returns: ( )
Returns 2 outputs:
1st is the % of Printed Bars that have printed within the within the span of time you input in the '_barCntLength' parameter.
2nd is true/false according to if the Printed BarCount % is above the threshold that you input into the '_barCntPercentMin' parameter.
RCI(_rciLength, _source, _interval)
You will see me using this a lot. DEFINITELY my favorite oscillator to utilize for SO many different things from
timing entries/exits to determining trends.Calculation of this indicator based on Spearmans Correlation.
Parameters:
_rciLength (int) : (int)
Amount of bars back to use in RCI calculations.
_source (float) : (float)
Source to use in RCI calculations (can use ANY source series. Ie, open,close,high,low,etc).
_interval (int) : (int)
Optional(if parameter not included, it defaults to 3). RCI calculation groups bars by this amount and then will.
rank these groups of bars.
Returns: (float)
Returns a single RCI value that will oscillates between -100 and +100.
RCIAVG(firstLength, _amtBtLengths, _rciSMAlen, _source, _interval)
20 RCI's are averaged together to get this RCI Avg (Rank Correlation Index Average). Each RCI (of the 20 total RCI)
has a progressively LARGER Lookback Length. Though the RCI Lengths are not individually adjustable,
there are 2 factors that ARE:
(1) the Lookback Length of the 1st RCI and
(2) the amount of values between one RCI's Lookback Length and the next.
*** If you set 'firstLength' to it's default of 200 and '_amtBtLengths' to it's default of 120 (aka AMOUNT BETWEEN LENGTHS=120)...
then RCI_2 Length=320, RCI_3 Length=440, RCI_4 Length=560, and so on.
Parameters:
firstLength (int) : (int)
Optional(if parameter is not included when the function is called, then it defaults to 200).
This parameter is the Lookback Length for the 1st RCI used in the RCI Avg.
_amtBtLengths (int) : (int)
Optional(if parameter not included when the function is called, then it defaults to 120).
This parameter is the value amount between each of the progressively larger lengths used for the 20 RCI's that
are averaged in the RCI Avg.
***** BEWARE ***** Too large of a value here will cause the calc to look back too far, causing an error(thus the value must be lowered)
_rciSMAlen (int) : (int)
Unlike the Single RCI Function, this function smooths out the end result using an SMA with a length value that is this parameter.
_source (float) : (float)
Source to use in RCI calculations (can use ANY source series. Ie, open,close,high,low,etc).
_interval (int) : (int)
Optional(if parameter not included, it defaults to 3). Within the RCI calculation, bars next to each other are grouped together
and then these groups are Ranked against each other. This parameter is the number of adjacent bars that are grouped together.
Returns: (float)
Returns a single RCI value that is the Avg of many RCI values that will oscillate between -100 and +100.
PercentChange(_startingValue, _endingValue)
This is a quick function to calculate how much % change has occurred between the '_startingValue' and the '_endingValue'
that you input into the function.
Parameters:
_startingValue (float) : (float)
The source value to START the % change calculation from.
_endingValue (float) : (float)
The source value to END the % change caluclation from.
Returns: Returns a single output being the % value between 0-100 (with trailing numbers behind a decimal). If you want only
a certain amount of numbers behind the decimal, this function needs to be put within a formatting function to do so.
Rescale(_source, _oldMin, _oldMax, _newMin, _newMax)
Rescales series with a known '_oldMin' & '_oldMax'. Use this when the scale of the '_source' to
rescale is known (bounded).
Parameters:
_source (float) : (float)
Source to be normalized.
_oldMin (int) : (float)
The known minimum of the '_source'.
_oldMax (int) : (float)
The known maximum of the '_source'.
_newMin (int) : (float)
What you want the NEW minimum of the '_source' to be.
_newMax (int) : (float)
What you want the NEW maximum of the '_source' to be.
Returns: Outputs your previously bounded '_source', but now the value will only move between the '_newMin' and '_newMax'
values you set in the variables.
Normalize_Historical(_source, _minimumLvl, _maximumLvl)
Normalizes '_source' that has a previously unknown min/max(unbounded) determining the max & min of the '_source'
FROM THE ENTIRE CHARTS HISTORY. ]
Parameters:
_source (float) : (float)
Source to be normalized.
_minimumLvl (int) : (float)
The Lower Boundary Level.
_maximumLvl (int) : (float)
The Upper Boundary Level.
Returns: Returns your same '_source', but now the value will MOSTLY stay between the minimum and maximum values you set in the
'_minimumLvl' and '_maximumLvl' variables (ie. if the source you input is an RSI...the output is the same RSI value but
instead of moving between 0-100 it will move between the maxand min you set).
Normailize_Local(_source, _length, _minimumLvl, _maximumLvl)
Normalizes series with previously unknown min/max(unbounded). Much like the Normalize_Historical function above this one,
but rather than using the Highest/Lowest Values within the ENTIRE charts history, this on looks for the Highest/Lowest
values of '_source' within the last ___ bars (set by user as/in the '_length' parameter. ]
Parameters:
_source (float) : (float)
Source to be normalized.
_length (int) : (float)
The amount of bars to look back to determine the highest/lowest '_source' value.
_minimumLvl (int) : (float)
The Lower Boundary Level.
_maximumLvl (int) : (float)
The Upper Boundary Level.
Returns: Returns a single output variable being the previously unbounded '_source' that is now normalized and bound between
the values used for '_minimumLvl'/'_maximumLvl' of the '_source' within the user defined lookback period.
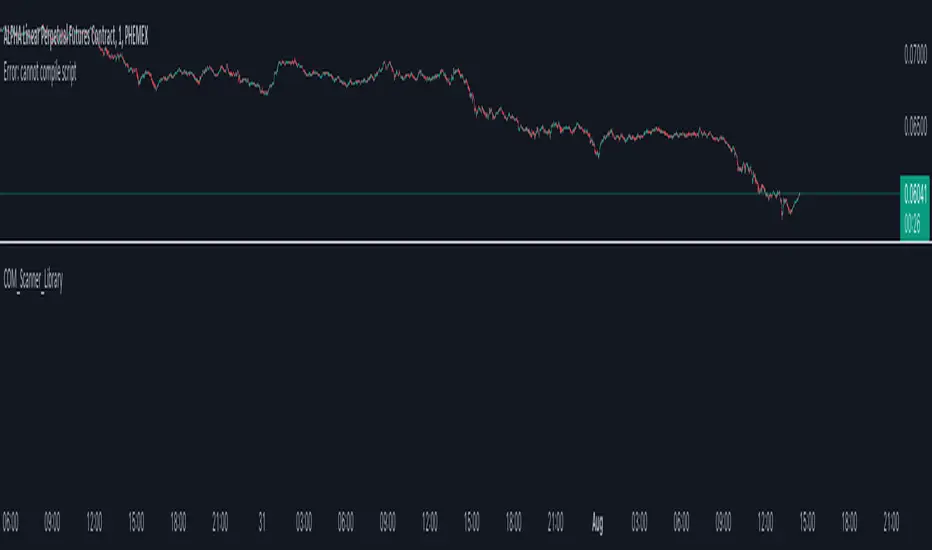
COMET_Scanner_Library_FINALLibrary "COMET_Scanner_Library"
- A Trader's Edge (ATE)_Library was created to assist in constructing COM Scanners
TickerIDs(_string)
TickerIDs: You must form this single tickerID input string exactly as described in the scripts info panel (little gray 'i' that
is circled at the end of the settings in the settings/input panel that you can hover your cursor over this 'i' to read the
details of that particular input). IF the string is formed correctly then it will break up this single string parameter into
a total of 40 separate strings which will be all of the tickerIDs that the script is using in your COM Scanner.
Parameters:
_string (simple string) : (string)
A maximum of 40 Tickers (ALL joined as 1 string for the input parameter) that is formulated EXACTLY as described
within the tooltips of the TickerID inputs in my COM Scanner scripts:
assets = input.text_area(tIDs, title="TickerIDs (MUST READ TOOLTIP)", group=g2, tooltip="Accepts 40 TICKERID's
for each copy of the script on the chart. \n\n*** MUST FORMAT THIS WAY ***\n\n Each FULL tickerID
(ie 'Exchange:ticker') must be separated by A SINGLE BLANK SPACE for correct formatting. The blank space tells
the script where to break off the ticker to assign it to a variable to be used later in the script. So this input
will be a single string constructed from up to 40 tickerID's with a space between each tickerID
(ie. 'BINANCE:BTCUSDT BINANCE:SXPUSDT BINANCE:XRPUSDT').", display=display.none)
Returns: Returns 40 output variables in the tuple (ie. between the ' ') with the separated TickerIDs,
Locations(_firstLocation)
Locations: This function is used when there's a desire to print an assets ALERT LABELS. A set Location on the scale is assigned to each asset.
This is created so that if a lot of alerts are triggered, they will stay relatively visible and not overlap each other.
If you set your '_firstLocation' parameter as 1, since there are a max of 40 assets that can be scanned, the 1st asset's location
is assigned the value in the '_firstLocation' parameter, the 2nd asset's location is the (1st asset's location+1)...and so on.
Parameters:
_firstLocation (simple int) : (simple int)
Optional (starts at 1 if no parameter added).
Location that you want the first asset to print its label if is triggered to do so.
ie. loc2=loc1+1, loc3=loc2+1, etc.
Returns: Returns 40 variables for the locations for alert labels
LabelSize(_barCnt, _lblSzRfrnce)
INVALID TICKERIDs: This is to add a table in the middle right of your chart that prints all the TickerID's that were either not formulated
correctly in the '_source' input or that is not a valid symbol and should be changed.
LABEL SIZES: This function sizes your Alert Trigger Labels according to the amount of Printed Bars the chart has printed within
a set time period, while also keeping in mind the smallest relative reference size you input in the 'lblSzRfrnceInput'
parameter of this function. A HIGHER % of Printed Bars(aka...more trades occurring for that asset on the exchange),
the LARGER the Name Label will print, potentially showing you the better opportunities on the exchange to avoid
exchange manipulation liquidations.
*** SHOULD NOT be used as size of labels that are your asset Name Labels next to each asset's Line Plot...
if your COM Scanner includes these as you want these to be the same size for every asset so the larger ones dont cover the
smaller ones if the plots are all close to each other ***
Parameters:
_barCnt (float) : (float)
Get the 1st variable('barCnt') from the Security function's tuple and input it as this functions 1st input
parameter which will directly affect the size of the 2nd output variable ('alertTrigLabel') that is also outputted by this function.
_lblSzRfrnce (string) : (string)
Optional (if parameter not included, it defaults to size.small). This will be the size of the variable outputted
by this function named 'assetNameLabel' BUT also affects the size of the output variable 'alertTrigLabel' as it uses this parameter's size
as the smallest size for 'alertTrigLabel' then uses the '_barCnt' parameter to determine the next sizes up depending on the "_barCnt" value.
Returns: ( )
Returns 2 variables:
1st output variable ('AssetNameLabel') is assigned to the size of the 'lblSzRfrnceInput' parameter.
2nd output variable('alertTrigLabel') can be of variying sizes depending on the 'barCnt' parameter...BUT the smallest
size possible for the 2nd output variable ('alertTrigLabel') will be the size set in the 'lblSzRfrnceInput' parameter.
InvalidTickerIDs(_close, _securityTickerid, _invalidArray, _tablePosition, _stackVertical)
Parameters:
_close (float)
_securityTickerid (string)
_invalidArray (array)
_tablePosition (simple string)
_stackVertical (simple bool)
PrintedBarCount(_time, _barCntLength, _barCntPercentMin)
The Printed BarCount Filter looks back a User Defined amount of minutes and calculates the % of bars that have printed
out of the TOTAL amount of bars that COULD HAVE been printed within the same amount of time.
Parameters:
_time (int) : (int)
The time associated with the chart of the particular asset that is being screened at that point.
_barCntLength (int) : (int)
The amount of time (IN MINUTES) that you want the logic to look back at to calculate the % of bars that have actually
printed in the span of time you input into this parameter.
_barCntPercentMin (int) : (int)
The minimum % of Printed Bars of the asset being screened has to be GREATER than the value set in this parameter
for the output variable 'bc_gtg' to be true.
Returns: ( )
Returns 2 outputs:
1st is the % of Printed Bars that have printed within the within the span of time you input in the '_barCntLength' parameter.
2nd is true/false according to if the Printed BarCount % is above the threshold that you input into the '_barCntPercentMin' parameter.

COM_Scanner_LibraryLibrary "COM_Scanner_Library"
- A Trader's Edge (ATE)_Library was created to assist in constructing COM Scanners
TickerIDs(_string)
TickerIDs: You must form this single tickerID input string exactly as described in the scripts info panel (little gray 'i' that
is circled at the end of the settings in the settings/input panel that you can hover your cursor over this 'i' to read the
details of that particular input). IF the string is formed correctly then it will break up this single string parameter into
a total of 40 separate strings which will be all of the tickerIDs that the script is using in your COM Scanner.
Parameters:
_string (simple string) : (string)
A maximum of 40 Tickers (ALL joined as 1 string for the input parameter) that is formulated EXACTLY as described
within the tooltips of the TickerID inputs in my COM Scanner scripts:
assets = input.text_area(tIDs, title="TickerIDs (MUST READ TOOLTIP)", group=g2, tooltip="Accepts 40 TICKERID's
for each copy of the script on the chart. \n\n*** MUST FORMAT THIS WAY ***\n\n Each FULL tickerID
(ie 'Exchange:ticker') must be separated by A SINGLE BLANK SPACE for correct formatting. The blank space tells
the script where to break off the ticker to assign it to a variable to be used later in the script. So this input
will be a single string constructed from up to 40 tickerID's with a space between each tickerID
(ie. 'BINANCE:BTCUSDT BINANCE:SXPUSDT BINANCE:XRPUSDT').", display=display.none)
Returns: Returns 40 output variables in the tuple (ie. between the ' ') with the separated TickerIDs,
Locations(_firstLocation)
Locations: This function is used when there's a desire to print an assets ALERT LABELS. A set Location on the scale is assigned to each asset.
This is created so that if a lot of alerts are triggered, they will stay relatively visible and not overlap each other.
If you set your '_firstLocation' parameter as 1, since there are a max of 40 assets that can be scanned, the 1st asset's location
is assigned the value in the '_firstLocation' parameter, the 2nd asset's location is the (1st asset's location+1)...and so on.
Parameters:
_firstLocation (simple int) : (simple int)
Optional (starts at 1 if no parameter added).
Location that you want the first asset to print its label if is triggered to do so.
ie. loc2=loc1+1, loc3=loc2+1, etc.
Returns: Returns 40 variables for the locations for alert labels
LabelSize(_barCnt, _lblSzRfrnce)
INVALID TICKERIDs: This is to add a table in the middle right of your chart that prints all the TickerID's that were either not formulated
correctly in the '_source' input or that is not a valid symbol and should be changed.
LABEL SIZES: This function sizes your Alert Trigger Labels according to the amount of Printed Bars the chart has printed within
a set time period, while also keeping in mind the smallest relative reference size you input in the 'lblSzRfrnceInput'
parameter of this function. A HIGHER % of Printed Bars(aka...more trades occurring for that asset on the exchange),
the LARGER the Name Label will print, potentially showing you the better opportunities on the exchange to avoid
exchange manipulation liquidations.
*** SHOULD NOT be used as size of labels that are your asset Name Labels next to each asset's Line Plot...
if your COM Scanner includes these as you want these to be the same size for every asset so the larger ones dont cover the
smaller ones if the plots are all close to each other ***
Parameters:
_barCnt (float) : (float)
Get the 1st variable('barCnt') from the Security function's tuple and input it as this functions 1st input
parameter which will directly affect the size of the 2nd output variable ('alertTrigLabel') that is also outputted by this function.
_lblSzRfrnce (string) : (string)
Optional (if parameter not included, it defaults to size.small). This will be the size of the variable outputted
by this function named 'assetNameLabel' BUT also affects the size of the output variable 'alertTrigLabel' as it uses this parameter's size
as the smallest size for 'alertTrigLabel' then uses the '_barCnt' parameter to determine the next sizes up depending on the "_barCnt" value.
Returns: ( )
Returns 2 variables:
1st output variable ('AssetNameLabel') is assigned to the size of the 'lblSzRfrnceInput' parameter.
2nd output variable('alertTrigLabel') can be of variying sizes depending on the 'barCnt' parameter...BUT the smallest
size possible for the 2nd output variable ('alertTrigLabel') will be the size set in the 'lblSzRfrnceInput' parameter.
InvalidTickerIDs(_close, _securityTickerid, _invalidArray, _tablePosition, _stackVertical)
Parameters:
_close (float)
_securityTickerid (string)
_invalidArray (array)
_tablePosition (simple string)
_stackVertical (simple bool)
PrintedBarCount(_time, _barCntLength, _barCntPercentMin)
The Printed BarCount Filter looks back a User Defined amount of minutes and calculates the % of bars that have printed
out of the TOTAL amount of bars that COULD HAVE been printed within the same amount of time.
Parameters:
_time (int) : (int)
The time associated with the chart of the particular asset that is being screened at that point.
_barCntLength (int) : (int)
The amount of time (IN MINUTES) that you want the logic to look back at to calculate the % of bars that have actually
printed in the span of time you input into this parameter.
_barCntPercentMin (int) : (int)
The minimum % of Printed Bars of the asset being screened has to be GREATER than the value set in this parameter
for the output variable 'bc_gtg' to be true.
Returns: ( )
Returns 2 outputs:
1st is the % of Printed Bars that have printed within the within the span of time you input in the '_barCntLength' parameter.
2nd is true/false according to if the Printed BarCount % is above the threshold that you input into the '_barCntPercentMin' parameter.
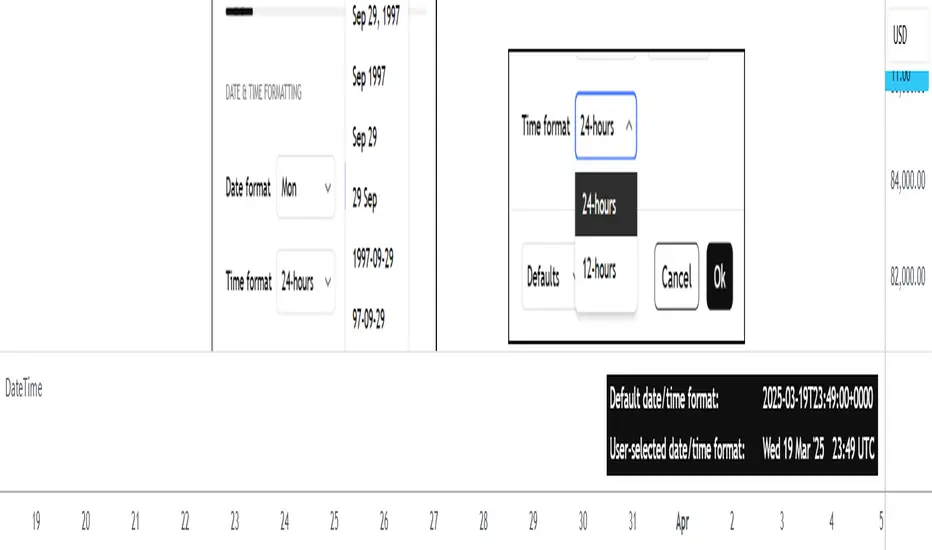
DateTimeLibrary with enums that can be used as script inputs to allow users to set their preferred date and/or time formats. The user-selected formats can be passed to the library functions (which use 𝚜𝚝𝚛.𝚏𝚘𝚛𝚖𝚊𝚝_𝚝𝚒𝚖𝚎() under the hood) to get formatted date and time strings from a UNIX time.
PREFACE
The target audience of this publication is users creating their own indicators/strategies.
Sometimes a date and/or time needs to be displayed to the user. As a Pine Coder, it is natural to focus our initial attention on the primary calculations or functions of a script, which can lead to the display format of dates and times being an afterthought. While it may not be crucial for the main use case of a script, increased customizability can help push indicators/strategies to the next level in the eyes of the user.
The purpose of this library is to provide an easy-to-use mechanism for allowing script users to choose the formats of dates and times that are displayed to them. Not only is this helpful for users from around the world who may be accustomed to different date/time formats, but it also makes it easier for the script author because it offloads the date/time formatting decision from the author to the user.
HOW TO USE
Step 1
Import the library. Replace with the latest available version number for this library.
//@version=6
indicator("Example")
import n00btraders/DateTime/ as dt
Step 2
Select a date format and/or time format enum to be used as an input.
dateFormatInput = input.enum(dt.DateFormat.FORMAT_3, "Date format")
timeFormatInput = input.enum(dt.TimeFormat.TWENTY_FOUR_HOURS, "Time hours format")
Step 3
Pass the user's selection as the `format` parameter in the formatting functions from this library. The `timestamp` & `timezone` parameters can be any value that would otherwise be used in 𝚜𝚝𝚛.𝚏𝚘𝚛𝚖𝚊𝚝_𝚝𝚒𝚖𝚎(𝚝𝚒𝚖𝚎, 𝚏𝚘𝚛𝚖𝚊𝚝, 𝚝𝚒𝚖𝚎𝚣𝚘𝚗𝚎).
string formattedDate = dt.formatDate(timestamp, dateFormatInput, timezone)
string formattedTime = dt.formatTime(timestamp, timeFormatInput, timezone)
LIMITATIONS
The library's ease-of-use comes at a few costs:
Fixed date/time formats.
Using the library's pre-defined date & time formats means that additional custom formats cannot be utilized. For example, this library does not include seconds or fractional seconds in formatted time strings. If a script's use case requires displaying the 'seconds' from a time of day, then 𝚜𝚝𝚛.𝚏𝚘𝚛𝚖𝚊𝚝_𝚝𝚒𝚖𝚎() must be used directly.
Fixed time zone offset format.
The `formatTime()` function of this library can optionally add the time zone offset at the end of the time string, but the format of the offset cannot be specified. Note: if the default format for time zone offset is not sufficient, the Timezone library can be imported directly to get the time zone offset string in a preferred format.
ADVANTAGES
There are benefits to utilizing this library instead of directly using 𝚜𝚝𝚛.𝚏𝚘𝚛𝚖𝚊𝚝_𝚝𝚒𝚖𝚎():
Easy to use from the user's perspective.
The date & time format enums provide a similar look and feel to the "Date format" and "Time hours format" options that already exist in the TradingView chart settings.
Easy to use from the author's perspective.
The exported functions from this library are modeled to behave similarly to the 𝚜𝚝𝚛.𝚏𝚘𝚛𝚖𝚊𝚝_𝚝𝚒𝚖𝚎(𝚝𝚒𝚖𝚎, 𝚏𝚘𝚛𝚖𝚊𝚝, 𝚝𝚒𝚖𝚎𝚣𝚘𝚗𝚎) built-in function from Pine Script.
Format quarter of the year.
The date formatting function from this library can display a fiscal quarter if it's included in the user-selected format. This is currently not possible with the built-in 𝚜𝚝𝚛.𝚏𝚘𝚛𝚖𝚊𝚝_𝚝𝚒𝚖𝚎().
EXPORTED ENUM TYPES
This section will list the available date/time formats that can be used as a script input. Each enum type has a detailed //@𝚏𝚞𝚗𝚌𝚝𝚒𝚘𝚗 description in the source code to help determine the best choice for your scripts.
Date Format Enums:
𝙳𝚊𝚝𝚎𝙵𝚘𝚛𝚖𝚊𝚝
𝙳𝚊𝚝𝚎𝙵𝚘𝚛𝚖𝚊𝚝𝙳𝚊𝚢𝙾𝚏𝚆𝚎𝚎𝚔𝙰𝚋𝚋𝚛
𝙳𝚊𝚝𝚎𝙵𝚘𝚛𝚖𝚊𝚝𝙳𝚊𝚢𝙾𝚏𝚆𝚎𝚎𝚔𝙵𝚞𝚕𝚕
𝙲𝚞𝚜𝚝𝚘𝚖𝙳𝚊𝚝𝚎𝙵𝚘𝚛𝚖𝚊𝚝
Supporting Date Enums:
𝙳𝚊𝚝𝚎𝙿𝚛𝚎𝚏𝚒𝚡
Time Format Enums:
𝚃𝚒𝚖𝚎𝙵𝚘𝚛𝚖𝚊𝚝
Supporting Time Enums:
𝚃𝚒𝚖𝚎𝙰𝚋𝚋𝚛𝚎𝚟𝚒𝚊𝚝𝚒𝚘𝚗
𝚃𝚒𝚖𝚎𝚂𝚎𝚙𝚊𝚛𝚊𝚝𝚘𝚛
𝚃𝚒𝚖𝚎𝙿𝚘𝚜𝚝𝚏𝚒𝚡
Note: all exported enums have custom titles for each field. This means that the supporting enums could also be exposed to the end-user as script inputs if necessary. The supporting enums are used as optional parameters in this library's formatting functions to allow further customizability.
EXPORTED FUNCTIONS
formatDate(timestamp, format, timezone, prefix, trim)
Converts a UNIX time into a date string formatted according to the selected `format`.
Parameters:
timestamp (series int) : A UNIX time.
format (series DateFormat) : A date format.
timezone (series string) : A UTC/GMT offset or IANA time zone identifier.
prefix (series DatePrefix) : Optional day of week prefix.
trim (series bool) : Optional truncation of numeric month / day.
Returns: Calendar date string using the selected format.
⸻⸻⸻⸻⸻⸻⸻⸻
Required parameters: `timestamp`, `format`.
Note: there is a version of this function for each Date Format enum type. The only difference is the type of the `format` parameter.
Tip: hover over the `formatDate()` function in the Pine Editor to display useful details:
Function description
Parameter descriptions + default values
Example function usage
formatTime(timestamp, format, timezone, trim, separator, postfix, space, offset)
Converts a UNIX time into a formatted time string using the 24-hour clock or 12-hour clock.
Parameters:
timestamp (series int) : A UNIX time.
format (series TimeFormat) : A time format.
timezone (series string) : A UTC/GMT offset or IANA time zone identifier.
trim (series TimeAbbreviation) : Optional truncation of the hour and minute portion.
separator (series TimeSeparator) : Optional time separator.
postfix (series TimePostfix) : Optional format for the AM/PM postfix.
space (series bool) : Optional space between the time and the postfix.
offset (series bool) : Optional UTC offset as a suffix.
Returns: Time of day string using the selected format.
⸻⸻⸻⸻⸻⸻⸻⸻
Required parameters: `timestamp`, `format`.
Note: the `trim`, `postfix`, and `space` optional parameters are not applicable and will be ignored when using the 24-hour clock (`format` = TimeFormat.TWENTY_FOUR_HOURS).
Tip: hover over the `formatTime()` function in the Pine Editor to display useful details:
Function description
Parameter descriptions + default values
Example function usage
Example outputs for combinations of TimeFormat.* enum values & optional parameters
NOTES
This library can be used in conjunction with the Timezone library to increase the usability of scripts that can benefit from allowing the user to input their preferred time zone.
Credits to HoanGhetti for publishing an informative Markdown resource which I referenced to create the formatted function descriptions that pop up when hovering over `formatDate()` and `formatTime()` function calls in the Pine Editor.
analytics_tablesLibrary "analytics_tables"
📝 Description
This library provides the implementation of several performance-related statistics and metrics, presented in the form of tables.
The metrics shown in the afforementioned tables where developed during the past years of my in-depth analalysis of various strategies in an atempt to reason about the performance of each strategy.
The visualization and some statistics where inspired by the existing implementations of the "Seasonality" script, and the performance matrix implementations of @QuantNomad and @ZenAndTheArtOfTrading scripts.
While this library is meant to be used by my strategy framework "Template Trailing Strategy (Backtester)" script, I wrapped it in a library hoping this can be usefull for other community strategy scripts that will be released in the future.
🤔 How to Guide
To use the functionality this library provides in your script you have to import it first!
Copy the import statement of the latest release by pressing the copy button below and then paste it into your script. Give a short name to this library so you can refer to it later on. The import statement should look like this:
import jason5480/analytics_tables/1 as ant
There are three types of tables provided by this library in the initial release. The stats table the metrics table and the seasonality table.
Each one shows different kinds of performance statistics.
The table UDT shall be initialized once using the `init()` method.
They can be updated using the `update()` method where the updated data UDT object shall be passed.
The data UDT can also initialized and get updated on demend depending on the use case
A code example for the StatsTable is the following:
var ant.StatsData statsData = ant.StatsData.new()
statsData.update(SideStats.new(), SideStats.new(), 0)
if (barstate.islastconfirmedhistory or (barstate.isrealtime and barstate.isconfirmed))
var statsTable = ant.StatsTable.new().init(ant.getTablePos('TOP', 'RIGHT'))
statsTable.update(statsData)
A code example for the MetricsTable is the following:
var ant.StatsData statsData = ant.StatsData.new()
statsData.update(ant.SideStats.new(), ant.SideStats.new(), 0)
if (barstate.islastconfirmedhistory or (barstate.isrealtime and barstate.isconfirmed))
var metricsTable = ant.MetricsTable.new().init(ant.getTablePos('BOTTOM', 'RIGHT'))
metricsTable.update(statsData, 10)
A code example for the SeasonalityTable is the following:
var ant.SeasonalData seasonalData = ant.SeasonalData.new().init(Seasonality.monthOfYear)
seasonalData.update()
if (barstate.islastconfirmedhistory or (barstate.isrealtime and barstate.isconfirmed))
var seasonalTable = ant.SeasonalTable.new().init(seasonalData, ant.getTablePos('BOTTOM', 'LEFT'))
seasonalTable.update(seasonalData)
🏋️♂️ Please refer to the "EXAMPLE" regions of the script for more advanced and up to date code examples!
Special thanks to @Mrcrbw for the proposal to develop this library and @DCNeu for the constructive feedback 🏆.
getTablePos(ypos, xpos)
Get table position compatible string
Parameters:
ypos (simple string) : The position on y axise
xpos (simple string) : The position on x axise
Returns: The position to be passed to the table
method init(this, pos, height, width, positiveTxtColor, negativeTxtColor, neutralTxtColor, positiveBgColor, negativeBgColor, neutralBgColor)
Initialize the stats table object with the given colors in the given position
Namespace types: StatsTable
Parameters:
this (StatsTable) : The stats table object
pos (simple string) : The table position string
height (simple float) : The height of the table as a percentage of the charts height. By default, 0 auto-adjusts the height based on the text inside the cells
width (simple float) : The width of the table as a percentage of the charts height. By default, 0 auto-adjusts the width based on the text inside the cells
positiveTxtColor (simple color) : The text color when positive
negativeTxtColor (simple color) : The text color when negative
neutralTxtColor (simple color) : The text color when neutral
positiveBgColor (simple color) : The background color with transparency when positive
negativeBgColor (simple color) : The background color with transparency when negative
neutralBgColor (simple color) : The background color with transparency when neutral
method init(this, pos, height, width, neutralBgColor)
Initialize the metrics table object with the given colors in the given position
Namespace types: MetricsTable
Parameters:
this (MetricsTable) : The metrics table object
pos (simple string) : The table position string
height (simple float) : The height of the table as a percentage of the charts height. By default, 0 auto-adjusts the height based on the text inside the cells
width (simple float) : The width of the table as a percentage of the charts width. By default, 0 auto-adjusts the width based on the text inside the cells
neutralBgColor (simple color) : The background color with transparency when neutral
method init(this, seas)
Initialize the seasonal data
Namespace types: SeasonalData
Parameters:
this (SeasonalData) : The seasonal data object
seas (simple Seasonality) : The seasonality of the matrix data
method init(this, data, pos, maxNumOfYears, height, width, extended, neutralTxtColor, neutralBgColor)
Initialize the seasonal table object with the given colors in the given position
Namespace types: SeasonalTable
Parameters:
this (SeasonalTable) : The seasonal table object
data (SeasonalData) : The seasonality data of the table
pos (simple string) : The table position string
maxNumOfYears (simple int) : The maximum number of years that fit into the table
height (simple float) : The height of the table as a percentage of the charts height. By default, 0 auto-adjusts the height based on the text inside the cells
width (simple float) : The width of the table as a percentage of the charts width. By default, 0 auto-adjusts the width based on the text inside the cells
extended (simple bool) : The seasonal table with extended columns for performance
neutralTxtColor (simple color) : The text color when neutral
neutralBgColor (simple color) : The background color with transparency when neutral
method update(this, wins, losses, numOfInconclusiveExits)
Update the strategy info data of the strategy
Namespace types: StatsData
Parameters:
this (StatsData) : The strategy statistics object
wins (SideStats)
losses (SideStats)
numOfInconclusiveExits (int) : The number of inconclusive trades
method update(this, stats, positiveTxtColor, negativeTxtColor, negativeBgColor, neutralBgColor)
Update the stats table object with the given data
Namespace types: StatsTable
Parameters:
this (StatsTable) : The stats table object
stats (StatsData) : The stats data to update the table
positiveTxtColor (simple color) : The text color when positive
negativeTxtColor (simple color) : The text color when negative
negativeBgColor (simple color) : The background color with transparency when negative
neutralBgColor (simple color) : The background color with transparency when neutral
method update(this, stats, buyAndHoldPerc, positiveTxtColor, negativeTxtColor, positiveBgColor, negativeBgColor)
Update the metrics table object with the given data
Namespace types: MetricsTable
Parameters:
this (MetricsTable) : The metrics table object
stats (StatsData) : The stats data to update the table
buyAndHoldPerc (float) : The buy and hold percetage
positiveTxtColor (simple color) : The text color when positive
negativeTxtColor (simple color) : The text color when negative
positiveBgColor (simple color) : The background color with transparency when positive
negativeBgColor (simple color) : The background color with transparency when negative
method update(this)
Update the seasonal data based on the season and eon timeframe
Namespace types: SeasonalData
Parameters:
this (SeasonalData) : The seasonal data object
method update(this, data, positiveTxtColor, negativeTxtColor, neutralTxtColor, positiveBgColor, negativeBgColor, neutralBgColor, timeBgColor)
Update the seasonal table object with the given data
Namespace types: SeasonalTable
Parameters:
this (SeasonalTable) : The seasonal table object
data (SeasonalData) : The seasonal cell data to update the table
positiveTxtColor (simple color) : The text color when positive
negativeTxtColor (simple color) : The text color when negative
neutralTxtColor (simple color) : The text color when neutral
positiveBgColor (simple color) : The background color with transparency when positive
negativeBgColor (simple color) : The background color with transparency when negative
neutralBgColor (simple color) : The background color with transparency when neutral
timeBgColor (simple color) : The background color of the time gradient
SideStats
Object that represents the strategy statistics data of one side win or lose
Fields:
numOf (series int)
sumFreeProfit (series float)
freeProfitStDev (series float)
sumProfit (series float)
profitStDev (series float)
sumGain (series float)
gainStDev (series float)
avgQuantityPerc (series float)
avgCapitalRiskPerc (series float)
avgTPExecutedCount (series float)
avgRiskRewardRatio (series float)
maxStreak (series int)
StatsTable
Object that represents the stats table
Fields:
table (series table) : The actual table
rows (series int) : The number of rows of the table
columns (series int) : The number of columns of the table
StatsData
Object that represents the statistics data of the strategy
Fields:
wins (SideStats)
losses (SideStats)
numOfInconclusiveExits (series int)
avgFreeProfitStr (series string)
freeProfitStDevStr (series string)
lossFreeProfitStDevStr (series string)
avgProfitStr (series string)
profitStDevStr (series string)
lossProfitStDevStr (series string)
avgQuantityStr (series string)
MetricsTable
Object that represents the metrics table
Fields:
table (series table) : The actual table
rows (series int) : The number of rows of the table
columns (series int) : The number of columns of the table
SeasonalData
Object that represents the seasonal table dynamic data
Fields:
seasonality (series Seasonality)
eonToMatrixRow (map)
numOfEons (series int)
mostRecentMatrixRow (series int)
balances (matrix)
returnPercs (matrix)
maxDDs (matrix)
eonReturnPercs (array)
eonCAGRs (array)
eonMaxDDs (array)
SeasonalTable
Object that represents the seasonal table
Fields:
table (series table) : The actual table
headRows (series int) : The number of head rows of the table
headColumns (series int) : The number of head columns of the table
eonRows (series int) : The number of eon rows of the table
seasonColumns (series int) : The number of season columns of the table
statsRows (series int)
statsColumns (series int) : The number of stats columns of the table
rows (series int) : The number of rows of the table
columns (series int) : The number of columns of the table
extended (series bool) : Whether the table has additional performance statistics

FiniteStateMachine🟩 OVERVIEW
A flexible framework for creating, testing and implementing a Finite State Machine (FSM) in your script. FSMs use rules to control how states change in response to events.
This is the first Finite State Machine library on TradingView and it's quite a different way to think about your script's logic. Advantages of using this vs hardcoding all your logic include:
• Explicit logic : You can see all rules easily side-by-side.
• Validation : Tables show your rules and validation results right on the chart.
• Dual approach : Simple matrix for straightforward transitions; map implementation for concurrent scenarios. You can combine them for complex needs.
• Type safety : Shows how to use enums for robustness while maintaining string compatibility.
• Real-world examples : Includes both conceptual (traffic lights) and practical (trading strategy) demonstrations.
• Priority control : Explicit control over which rules take precedence when multiple conditions are met.
• Wildcard system : Flexible pattern matching for states and events.
The library seems complex, but it's not really. Your conditions, events, and their potential interactions are complex. The FSM makes them all explicit, which is some work. However, like all "good" pain in life, this is front-loaded, and *saves* pain later, in the form of unintended interactions and bugs that are very hard to find and fix.
🟩 SIMPLE FSM (MATRIX-BASED)
The simple FSM uses a matrix to define transition rules with the structure: state > event > state. We look up the current state, check if the event in that row matches, and if it does, output the resulting state.
Each row in the matrix defines one rule, and the first matching row, counting from the top down, is applied.
A limitation of this method is that you can supply only ONE event.
You can design layered rules using widlcards. Use an empty string "" or the special string "ANY" for any state or event wildcard.
The matrix FSM is foruse where you have clear, sequential state transitions triggered by single events. Think traffic lights, or any logic where only one thing can happen at a time.
The demo for this FSM is of traffic lights.
🟩 CONCURRENT FSM (MAP-BASED)
The map FSM uses a more complex structure where each state is a key in the map, and its value is an array of event rules. Each rule maps a named condition to an output (event or next state).
This FSM can handle multiple conditions simultaneously. Rules added first have higher priority.
Adding more rules to existing states combines the entries in the map (if you use the supplied helper function) rather than overwriting them.
This FSM is for more complex scenarios where multiple conditions can be true simultaneously, and you need to control which takes precedence. Like trading strategies, or any system with concurrent conditions.
The demo for this FSM is a trading strategy.
🟩 HOW TO USE
Pine Script libraries contain reusable code for importing into indicators. You do not need to copy any code out of here. Just import the library and call the function you want.
For example, for version 1 of this library, import it like this:
import SimpleCryptoLife/FiniteStateMachine/1
See the EXAMPLE USAGE sections within the library for examples of calling the functions.
For more information on libraries and incorporating them into your scripts, see the Libraries section of the Pine Script User Manual.
🟩 TECHNICAL IMPLEMENTATION
Both FSM implementations support wildcards using blank strings "" or the special string "ANY". Wildcards match in this priority order:
• Exact state + exact event match
• Exact state + empty event (event wildcard)
• Empty state + exact event (state wildcard)
• Empty state + empty event (full wildcard)
When multiple rules match the same state + event combination, the FIRST rule encountered takes priority. In the matrix FSM, this means row order determines priority. In the map FSM, it's the order you add rules to each state.
The library uses user-defined types for the map FSM:
• o_eventRule : Maps a condition name to an output
• o_eventRuleWrapper : Wraps an array of rules (since maps can't contain arrays directly)
Everything uses strings for maximum library compatibility, though the examples show how to use enums for type safety by converting them to strings.
Unlike normal maps where adding a duplicate key overwrites the value, this library's `m_addRuleToEventMap()` method *combines* rules, making it intuitive to build rule sets without breaking them.
🟩 VALIDATION & ERROR HANDLING
The library includes comprehensive validation functions that catch common FSM design errors:
Error detection:
• Empty next states
• Invalid states not in the states array
• Duplicate rules
• Conflicting transitions
• Unreachable states (no entry/exit rules)
Warning detection:
• Redundant wildcards
• Empty states/events (potential unintended wildcards)
• Duplicate conditions within states
You can display validation results in tables on the chart, with tooltips providing detailed explanations. The helper functions to display the tables are exported so you can call them from your own script.
🟩 PRACTICAL EXAMPLES
The library includes four comprehensive demos:
Traffic Light Demo (Simple FSM) : Uses the matrix FSM to cycle through traffic light states (red → red+amber → green → amber → red) with timer events. Includes pseudo-random "break" events and repair logic to demonstrate wildcards and priority handling.
Trading Strategy Demo (Concurrent FSM) : Implements a realistic long-only trading strategy using BOTH FSM types:
• Map FSM converts multiple technical conditions (EMA crosses, gaps, fractals, RSI) into prioritised events
• Matrix FSM handles state transitions (idle → setup → entry → position → exit → re-entry)
• Includes position management, stop losses, and re-entry logic
Error Demonstrations : Both FSM types include error demos with intentionally malformed rules to showcase the validation system's capabilities.
🟩 BRING ON THE FUNCTIONS
f_printFSMMatrix(_mat_rules, _a_states, _tablePosition)
Prints a table of states and rules to the specified position on the chart. Works only with the matrix-based FSM.
Parameters:
_mat_rules (matrix)
_a_states (array)
_tablePosition (simple string)
Returns: The table of states and rules.
method m_loadMatrixRulesFromText(_mat_rules, _rulesText)
Loads rules into a rules matrix from a multiline string where each line is of the form "current state | event | next state" (ignores empty lines and trims whitespace).
This is the most human-readable way to define rules because it's a visually aligned, table-like format.
Namespace types: matrix
Parameters:
_mat_rules (matrix)
_rulesText (string)
Returns: No explicit return. The matrix is modified as a side-effect.
method m_addRuleToMatrix(_mat_rules, _currentState, _event, _nextState)
Adds a single rule to the rules matrix. This can also be quite readble if you use short variable names and careful spacing.
Namespace types: matrix
Parameters:
_mat_rules (matrix)
_currentState (string)
_event (string)
_nextState (string)
Returns: No explicit return. The matrix is modified as a side-effect.
method m_validateRulesMatrix(_mat_rules, _a_states, _showTable, _tablePosition)
Validates a rules matrix and a states array to check that they are well formed. Works only with the matrix-based FSM.
Checks: matrix has exactly 3 columns; no empty next states; all states defined in array; no duplicate states; no duplicate rules; all states have entry/exit rules; no conflicting transitions; no redundant wildcards. To avoid slowing down the script unnecessarily, call this method once (perhaps using `barstate.isfirst`), when the rules and states are ready.
Namespace types: matrix
Parameters:
_mat_rules (matrix)
_a_states (array)
_showTable (bool)
_tablePosition (simple string)
Returns: `true` if the rules and states are valid; `false` if errors or warnings exist.
method m_getStateFromMatrix(_mat_rules, _currentState, _event, _strictInput, _strictTransitions)
Returns the next state based on the current state and event, or `na` if no matching transition is found. Empty (not na) entries are treated as wildcards if `strictInput` is false.
Priority: exact match > event wildcard > state wildcard > full wildcard.
Namespace types: matrix
Parameters:
_mat_rules (matrix)
_currentState (string)
_event (string)
_strictInput (bool)
_strictTransitions (bool)
Returns: The next state or `na`.
method m_addRuleToEventMap(_map_eventRules, _state, _condName, _output)
Adds a single event rule to the event rules map. If the state key already exists, appends the new rule to the existing array (if different). If the state key doesn't exist, creates a new entry.
Namespace types: map
Parameters:
_map_eventRules (map)
_state (string)
_condName (string)
_output (string)
Returns: No explicit return. The map is modified as a side-effect.
method m_addEventRulesToMapFromText(_map_eventRules, _configText)
Loads event rules from a multiline text string into a map structure.
Format: "state | condName > output | condName > output | ..." . Pairs are ordered by priority. You can have multiple rules on the same line for one state.
Supports wildcards: Use an empty string ("") or the special string "ANY" for state or condName to create wildcard rules.
Examples: " | condName > output" (state wildcard), "state | > output" (condition wildcard), " | > output" (full wildcard).
Splits lines by \n, extracts state as key, creates/appends to array with new o_eventRule(condName, output).
Call once, e.g., on barstate.isfirst for best performance.
Namespace types: map
Parameters:
_map_eventRules (map)
_configText (string)
Returns: No explicit return. The map is modified as a side-effect.
f_printFSMMap(_map_eventRules, _a_states, _tablePosition)
Prints a table of map-based event rules to the specified position on the chart.
Parameters:
_map_eventRules (map)
_a_states (array)
_tablePosition (simple string)
Returns: The table of map-based event rules.
method m_validateEventRulesMap(_map_eventRules, _a_states, _a_validEvents, _showTable, _tablePosition)
Validates an event rules map to check that it's well formed.
Checks: map is not empty; wrappers contain non-empty arrays; no duplicate condition names per state; no empty fields in o_eventRule objects; optionally validates outputs against matrix events.
NOTE: Both "" and "ANY" are treated identically as wildcards for both states and conditions.
To avoid slowing down the script unnecessarily, call this method once (perhaps using `barstate.isfirst`), when the map is ready.
Namespace types: map
Parameters:
_map_eventRules (map)
_a_states (array)
_a_validEvents (array)
_showTable (bool)
_tablePosition (simple string)
Returns: `true` if the event rules map is valid; `false` if errors or warnings exist.
method m_getEventFromConditionsMap(_currentState, _a_activeConditions, _map_eventRules)
Returns a single event or state string based on the current state and active conditions.
Uses a map of event rules where rules are pre-sorted by implicit priority via load order.
Supports wildcards using empty string ("") or "ANY" for flexible rule matching.
Priority: exact match > condition wildcard > state wildcard > full wildcard.
Namespace types: series string, simple string, input string, const string
Parameters:
_currentState (string)
_a_activeConditions (array)
_map_eventRules (map)
Returns: The output string (event or state) for the first matching condition, or na if no match found.
o_eventRule
o_eventRule defines a condition-to-output mapping for the concurrent FSM.
Fields:
condName (series string) : The name of the condition to check.
output (series string) : The output (event or state) when the condition is true.
o_eventRuleWrapper
o_eventRuleWrapper wraps an array of o_eventRule for use as map values (maps cannot contain collections directly).
Fields:
a_rules (array) : Array of o_eventRule objects for a specific state.

CCOMET_Scanner_LibraryLibrary "CCOMET_Scanner_Library"
- A Trader's Edge (ATE)_Library was created to assist in constructing CCOMET Scanners
Loc_tIDs_Col(_string, _firstLocation)
TickerIDs: You must form this single tickerID input string exactly as described in the scripts info panel (little gray 'i' that
is circled at the end of the settings in the settings/input panel that you can hover your cursor over this 'i' to read the
details of that particular input). IF the string is formed correctly then it will break up this single string parameter into
a total of 40 separate strings which will be all of the tickerIDs that the script is using in your CCOMET Scanner.
Locations: This function is used when there's a desire to print an assets ALERT LABELS. A set Location on the scale is assigned to each asset.
This is created so that if a lot of alerts are triggered, they will stay relatively visible and not overlap each other.
If you set your '_firstLocation' parameter as 1, since there are a max of 40 assets that can be scanned, the 1st asset's location
is assigned the value in the '_firstLocation' parameter, the 2nd asset's location is the (1st asset's location+1)...and so on.
Parameters:
_string (simple string) : (string)
A maximum of 40 Tickers (ALL joined as 1 string for the input parameter) that is formulated EXACTLY as described
within the tooltips of the TickerID inputs in my CCOMET Scanner scripts:
assets = input.text_area(tIDset1, title="TickerID (MUST READ TOOLTIP)", tooltip="Accepts 40 TICKERID's for each
copy of the script on the chart. TEXT FORMATTING RULES FOR TICKERID'S:
(1) To exclude the EXCHANGE NAME in the Labels, de-select the next input option.
(2) MUST have a space (' ') AFTER each TickerID.
(3) Capitalization in the Labels will match cap of these TickerID's.
(4) If your asset has a BaseCurrency & QuoteCurrency (ie. ADAUSDT ) BUT you ONLY want Labels
to show BaseCurrency(ie.'ADA'), include a FORWARD SLASH ('/') between the Base & Quote (ie.'ADA/USDT')", display=display.none)
_firstLocation (simple int) : (simple int)
Optional (starts at 1 if no parameter added).
Location that you want the first asset to print its label if is triggered to do so.
ie. loc2=loc1+1, loc3=loc2+1, etc.
Returns: Returns 40 output variables in the tuple (ie. between the ' ') with the TickerIDs, 40 variables for the locations for alert labels, and 40 Colors for labels/plots
TickeridForLabelsAndSecurity(_ticker, _includeExchange)
This function accepts the TickerID Name as its parameter and produces a single string that will be used in all of your labels.
Parameters:
_ticker (simple string) : (string)
For this parameter, input the varible named '_coin' from your 'f_main()' function for this parameter. It is the raw
Ticker ID name that will be processed.
_includeExchange (simple bool) : (bool)
Optional (if parameter not included in function it defaults to false ).
Used to determine if the Exchange name will be included in all labels/triggers/alerts.
Returns: ( )
Returns 2 output variables:
1st ('_securityTickerid') is to be used in the 'request.security()' function as this string will contain everything
TV needs to pull the correct assets data.
2nd ('lblTicker') is to be used in all of the labels in your CCOMET Scanner as it will only contain what you want your labels
to show as determined by how the tickerID is formulated in the CCOMET Scanner's input.
InvalID_LblSz(_barCnt, _close, _securityTickerid, _invalidArray, _tablePosition, _stackVertical, _lblSzRfrnce)
INVALID TICKERIDs: This is to add a table in the middle right of your chart that prints all the TickerID's that were either not formulated
correctly in the '_source' input or that is not a valid symbol and should be changed.
LABEL SIZES: This function sizes your Alert Trigger Labels according to the amount of Printed Bars the chart has printed within
a set time period, while also keeping in mind the smallest relative reference size you input in the 'lblSzRfrnceInput'
parameter of this function. A HIGHER % of Printed Bars(aka...more trades occurring for that asset on the exchange),
the LARGER the Name Label will print, potentially showing you the better opportunities on the exchange to avoid
exchange manipulation liquidations.
*** SHOULD NOT be used as size of labels that are your asset Name Labels next to each asset's Line Plot...
if your CCOMET Scanner includes these as you want these to be the same size for every asset so the larger ones dont cover the
smaller ones if the plots are all close to each other ***
Parameters:
_barCnt (float) : (float)
Get the 1st variable('barCnt') from the Security function's tuple and input it as this functions 1st input
parameter which will directly affect the size of the 2nd output variable ('alertTrigLabel') that is also outputted by this function.
_close (float) : (float)
Put your 'close' variable named '_close' from the security function here.
_securityTickerid (string) : (string)
Throughout the entire charts updates, if a '_close' value is never registered then the logic counts the asset as INVALID.
This will be the 1st TickerID variable (named _securityTickerid) outputted from the tuple of the TickeridForLabels()
function above this one.
_invalidArray (array) : (array string)
Input the array from the original script that houses all of the invalidArray strings.
_tablePosition (simple string) : (string)
Optional (if parameter not included, it defaults to position.middle_right). Location on the chart you want the table printed.
Possible strings include: position.top_center, position.top_left, position.top_right, position.middle_center,
position.middle_left, position.middle_right, position.bottom_center, position.bottom_left, position.bottom_right.
_stackVertical (simple bool) : (bool)
Optional (if parameter not included, it defaults to true). All of the assets that are counted as INVALID will be
created in a list. If you want this list to be prited as a column then input 'true' here, otherwise they will all be in a row.
_lblSzRfrnce (string) : (string)
Optional (if parameter not included, it defaults to size.small). This will be the size of the variable outputted
by this function named 'assetNameLabel' BUT also affects the size of the output variable 'alertTrigLabel' as it uses this parameter's size
as the smallest size for 'alertTrigLabel' then uses the '_barCnt' parameter to determine the next sizes up depending on the "_barCnt" value.
Returns: ( )
Returns 2 variables:
1st output variable ('AssetNameLabel') is assigned to the size of the 'lblSzRfrnceInput' parameter.
2nd output variable('alertTrigLabel') can be of variying sizes depending on the 'barCnt' parameter...BUT the smallest
size possible for the 2nd output variable ('alertTrigLabel') will be the size set in the 'lblSzRfrnceInput' parameter.
PrintedBarCount(_time, _barCntLength, _barCntPercentMin)
The Printed BarCount Filter looks back a User Defined amount of minutes and calculates the % of bars that have printed
out of the TOTAL amount of bars that COULD HAVE been printed within the same amount of time.
Parameters:
_time (int) : (int)
The time associated with the chart of the particular asset that is being screened at that point.
_barCntLength (int) : (int)
The amount of time (IN MINUTES) that you want the logic to look back at to calculate the % of bars that have actually
printed in the span of time you input into this parameter.
_barCntPercentMin (int) : (int)
The minimum % of Printed Bars of the asset being screened has to be GREATER than the value set in this parameter
for the output variable 'bc_gtg' to be true.
Returns: ( )
Returns 2 outputs:
1st is the % of Printed Bars that have printed within the within the span of time you input in the '_barCntLength' parameter.
2nd is true/false according to if the Printed BarCount % is above the threshold that you input into the '_barCntPercentMin' parameter.

signal_datagramThe purpose of this library is to split and merge an integer into useful pieces of information that can easily handled and plotted.
The basic piece of information is one word. Depending on the underlying numerical system a word can be a bit, octal, digit, nibble, or byte.
The user can define channels. Channels are named groups of words. Multiple words can be combined to increase the value range of a channel.
A datagram is a description of the user-defined channels in an also user-defined numeric system that also contains all runtime information that is necessary to split and merge the integer.
This library simplifies the communication between two scripts by allowing the user to define the same datagram in both scripts.
On the sender's side, the channel values can be merged into one single integer value called signal. This signal can be 'emitted' using the plot function. The other script can use the 'input.source' function to receive that signal.
On the receiver's end based on the same datagram, the signal can be split into several channels. Each channel has the piece of information that the sender script put.
In the example of this library, we use two channels and we have split the integer in half. However, the user can add new channels, change them, and give meaning to them according to the functionality he wants to implement and the type of information he wants to communicate.
Nowadays many 'input.source' calls are allowed to pass information between the scripts, When that is not a price or a floating value, this library is very useful.
The reason is that most of the time, the convention that is used is not clear enough and it is easy to do things the wrong way or break them later on.
With this library validation checks are done during the initialization minimizing the possibility of error due to some misconceptions.
Library "signal_datagram"
Conversion of a datagram type to a signal that can be "send" as a single value from an indicator to a strategy script
method init(this, positions, maxWords)
init - Initialize if the word positons array with an empty array
Namespace types: WordPosArray
Parameters:
this (WordPosArray) : - The word positions array object
positions (int ) : - The array that contains all the positions of the worlds that shape the channel
maxWords (int) : - The maximum words allowed based on the span
Returns: The initialized object
method init(this)
init - Initialize if the channels word positons map with an empty map
Namespace types: ChannelDesc
Parameters:
this (ChannelDesc) : - The channels' descriptor object
Returns: The initialized object
method init(this, numericSystem, channelDesc)
init - Initialize if the datagram
Namespace types: Datagram
Parameters:
this (Datagram) : - The datagram object
numericSystem (simple string) : - The numeric system of the words to be used
channelDesc (ChannelDesc) : - The channels descriptor that contains the positions of the words that each channel consists of
Returns: The initialized object
method add_channel(this, name, positions)
add_channel - Add a new channel descriptopn with its name and its corresponding word positons to the map
Namespace types: ChannelDesc
Parameters:
this (ChannelDesc) : - The channels' descriptor object to update
name (simple string)
positions (int )
Returns: The initialized object
method set_signal(this, value)
set_signal - Set the signal value
Namespace types: Datagram
Parameters:
this (Datagram) : - The datagram object to update
value (int) : - The signal value to set
method get_signal(this)
get_signal - Get the signal value
Namespace types: Datagram
Parameters:
this (Datagram) : - The datagram object to query
Returns: The value of the signal in digits
method set_signal_sign(this, sign)
set_signal_sign - Set the signal sign
Namespace types: Datagram
Parameters:
this (Datagram) : - The datagram object to update
sign (int) : - The negative -1 or positive 1 sign of the underlying value
method get_signal_sign(this)
get_signal_sign - Get the signal sign
Namespace types: Datagram
Parameters:
this (Datagram) : - The datagram object to query
Returns: The sign of the signal value -1 if it is negative and 1 if it is possitive
method get_channel_names(this)
get_channel_names - Get an array of all channel names
Namespace types: Datagram
Parameters:
this (Datagram)
Returns: An array that has all the channel names that are used by the datagram
method set_channel_value(this, channelName, value)
set_channel_value - Set the value of the channel
Namespace types: Datagram
Parameters:
this (Datagram) : - The datagram object to update
channelName (simple string) : - The name of the channel to set the value to. Then name should be as described int the schemas channel descriptor
value (int) : - The channel value to set
method set_all_channels_value(this, value)
set_all_channels_value - Set the value of all the channels
Namespace types: Datagram
Parameters:
this (Datagram) : - The datagram object to update
value (int) : - The channel value to set
method set_all_channels_max_value(this)
set_all_channels_value - Set the value of all the channels
Namespace types: Datagram
Parameters:
this (Datagram) : - The datagram object to update
method get_channel_value(this, channelName)
get_channel_value - Get the value of the channel
Namespace types: Datagram
Parameters:
this (Datagram) : - The datagram object to query
channelName (simple string)
Returns: Digit group of words (bits/octals/digits/nibbles/hexes/bytes) found at the channel accodring to the schema
WordDesc
Fields:
numericSystem (series__string)
span (series__integer)
WordPosArray
Fields:
positions (array__integer)
ChannelDesc
Fields:
map (map__series__string:|WordPosArray|#OBJ)
Schema
Fields:
wordDesc (|WordDesc|#OBJ)
channelDesc (|ChannelDesc|#OBJ)
Signal
Fields:
value (series__integer)
isNegative (series__bool)
words (array__integer)
Datagram
Fields:
schema (|Schema|#OBJ)
signal (|Signal|#OBJ)
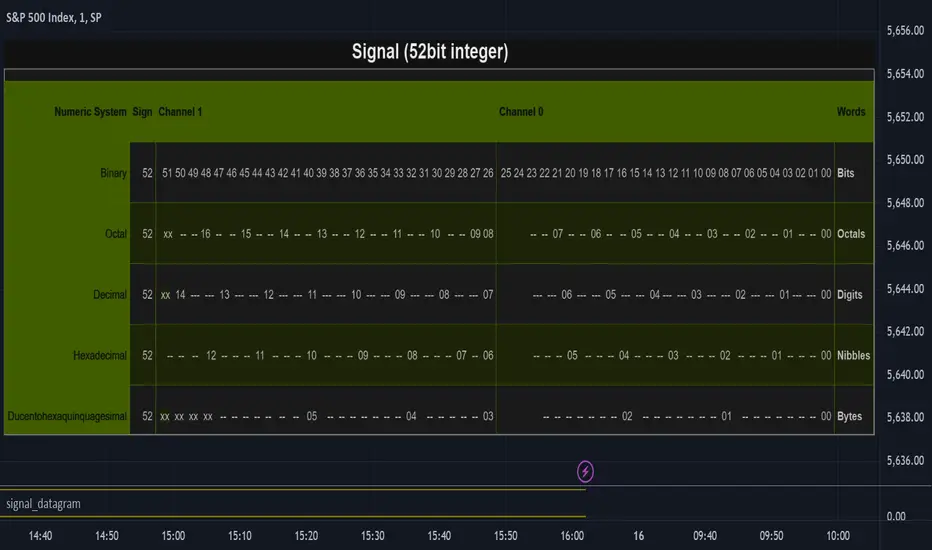
LibTmFrLibrary "LibTmFr"
This is a utility library for handling timeframes and
multi-timeframe (MTF) analysis in Pine Script. It provides a
collection of functions designed to handle common tasks related
to period detection, session alignment, timeframe construction,
and time calculations, forming a foundation for
MTF indicators.
Key Capabilities:
1. **MTF Period Engine:** The library includes functions for
managing higher-timeframe (HTF) periods.
- **Period Detection (`isNewPeriod`):** Detects the first bar
of a given timeframe. It includes custom logic to handle
multi-month and multi-year intervals where
`timeframe.change()` may not be sufficient.
- **Bar Counting (`sinceNewPeriod`):** Counts the number of
bars that have passed in the current HTF period or
returns the final count for a completed historical period.
2. **Automatic Timeframe Selection:** Offers functions for building
a top-down analysis framework:
- **Automatic HTF (`autoHTF`):** Suggests a higher timeframe
(HTF) for broader context based on the current timeframe.
- **Automatic LTF (`autoLTF`):** Suggests an appropriate lower
timeframe (LTF) for granular intra-bar analysis.
3. **Timeframe Manipulation and Comparison:** Includes tools for
working with timeframe strings:
- **Build & Split (`buildTF`, `splitTF`):** Functions to
programmatically construct valid Pine Script timeframe
strings (e.g., "4H") and parse them back into their
numeric and unit components.
- **Comparison (`isHigherTF`, `isActiveTF`, `isLowerTF`):**
A set of functions to check if a given timeframe is
higher, lower, or the same as the script's active timeframe.
- **Multiple Validation (`isMultipleTF`):** Checks if a
higher timeframe is a practical multiple of the current
timeframe. This is based on the assumption that checking
if recent, completed HTF periods contained more than one
bar is a valid proxy for preventing data gaps.
4. **Timestamp Interpolation:** Contains an `interpTimestamp()`
function that calculates an absolute timestamp by
interpolating at a given percentage across a specified
range of bars (e.g., 50% of the way through the last
20 bars), enabling time calculations at a resolution
finer than the chart's native bars.
---
**DISCLAIMER**
This library is provided "AS IS" and for informational and
educational purposes only. It does not constitute financial,
investment, or trading advice.
The author assumes no liability for any errors, inaccuracies,
or omissions in the code. Using this library to build
trading indicators or strategies is entirely at your own risk.
As a developer using this library, you are solely responsible
for the rigorous testing, validation, and performance of any
scripts you create based on these functions. The author shall
not be held liable for any financial losses incurred directly
or indirectly from the use of this library or any scripts
derived from it.
buildTF(quantity, unit)
Builds a Pine Script timeframe string from a numeric quantity and a unit enum.
The resulting string can be used with `request.security()` or `input.timeframe`.
Parameters:
quantity (int) : series int Number to specifie how many `unit` the timeframe spans.
unit (series TFUnit) : series TFUnit The size category for the bars.
Returns: series string A Pine-style timeframe identifier, e.g.
"5S" → 5-seconds bars
"30" → 30-minute bars
"120" → 2-hour bars
"1D" → daily bars
"3M" → 3-month bars
"24M" → 2-year bars
splitTF(tf)
Splits a Pine‑timeframe identifier into numeric quantity and unit (TFUnit).
Parameters:
tf (string) : series string Timeframe string, e.g.
"5S", "30", "120", "1D", "3M", "24M".
Returns:
quantity series int The numeric value of the timeframe (e.g., 15 for "15", 3 for "3M").
unit series TFUnit The unit of the timeframe (e.g., TFUnit.minutes, TFUnit.months).
Notes on strings without a suffix:
• Pure digits are minutes; if divisible by 60, they are treated as hours.
• An "M" suffix is months; if divisible by 12, it is converted to years.
autoHTF(tf)
Picks an appropriate **higher timeframe (HTF)** relative to the selected timeframe.
It steps up along a coarse ladder to produce sensible jumps for top‑down analysis.
Mapping → chosen HTF:
≤ 1 min → 60 (1h) ≈ ×60
≤ 3 min → 180 (3h) ≈ ×60
≤ 5 min → 240 (4h) ≈ ×48
≤ 15 min → D (1 day) ≈ ×26–×32 (regular session 6.5–8 h)
> 15 min → W (1 week) ≈ ×64–×80 for 30m; varies with input
≤ 1 h → W (1 week) ≈ ×32–×40
≤ 4 h → M (1 month) ≈ ×36–×44 (~22 trading days / month)
> 4 h → 3M (3 months) ≈ ×36–×66 (e.g., 12h→×36–×44; 8h→×53–×66)
≤ 1 day → 3M (3 months) ≈ ×60–×66 (~20–22 trading days / month)
> 1 day → 12M (1 year) ≈ ×(252–264)/quantity
≤ 1 week → 12M (1 year) ≈ ×52
> 1 week → 48M (4 years) ≈ ×(208)/quantity
= 1 M → 48M (4 years) ≈ ×48
> 1 M → error ("HTF too big")
any → error ("HTF too big")
Notes:
• Inputs in months or years are restricted: only 1M is allowed; larger months/any years throw.
• Returns a Pine timeframe string usable in `request.security()` and `input.timeframe`.
Parameters:
tf (string) : series string Selected timeframe (e.g., "D", "240", or `timeframe.period`).
Returns: series string Suggested higher timeframe.
autoLTF(tf)
Selects an appropriate **lower timeframe LTF)** for intra‑bar evaluation
based on the selected timeframe. The goal is to keep intra‑bar
loops performant while providing enough granularity.
Mapping → chosen LTF:
≤ 1 min → 1S ≈ ×60
≤ 5 min → 5S ≈ ×60
≤ 15 min → 15S ≈ ×60
≤ 30 min → 30S ≈ ×60
> 30 min → 60S (1m) ≈ ×31–×59 (for 31–59 minute charts)
≤ 1 h → 1 (1m) ≈ ×60
≤ 2 h → 2 (2m) ≈ ×60
≤ 4 h → 5 (5m) ≈ ×48
> 4 h → 15 (15m) ≈ ×24–×48 (e.g., 6h→×24, 8h→×32, 12h→×48)
≤ 1 day → 15 (15m) ≈ ×26–×32 (regular sessions ~6.5–8h)
> 1 day → 60 (60m) ≈ ×(26–32) per day × quantity
≤ 1 week → 60 (60m) ≈ ×32–×40 (≈5 sessions of ~6.5–8h)
> 1 week → 240 (4h) ≈ ×(8–10) per week × quantity
≤ 1 M → 240 (4h) ≈ ×33–×44 (~20–22 sessions × 6.5–8h / 4h)
≤ 3 M → D (1d) ≈ ×(20–22) per month × quantity
> 3 M → W (1w) ≈ ×(4–5) per month × quantity
≤ 1 Y → W (1w) ≈ ×52
> 1 Y → M (1M) ≈ ×12 per year × quantity
Notes:
• Ratios for D/W/M are given as ranges because they depend on
**regular session length** (typically ~6.5–8h, not 24h).
• Returned strings can be used with `request.security()` and `input.timeframe`.
Parameters:
tf (string) : series string Selected timeframe (e.g., "D", "240", or timeframe.period).
Returns: series string Suggested lower TF to use for intra‑bar work.
isNewPeriod(tf, offset)
Returns `true` when a new session-aligned period begins, or on the Nth bar of that period.
Parameters:
tf (string) : series string Target higher timeframe (e.g., "D", "W", "M").
offset (simple int) : simple int 0 → checks for the first bar of the new period.
1+ → checks for the N-th bar of the period.
Returns: series bool `true` if the condition is met.
sinceNewPeriod(tf, offset)
Counts how many bars have passed within a higher timeframe (HTF) period.
For daily, weekly, and monthly resolutions, the period is aligned with the trading session.
Parameters:
tf (string) : series string Target parent timeframe (e.g., "60", "D").
offset (simple int) : simple int 0 → Running count for the current period.
1+ → Finalized count for the Nth most recent *completed* period.
Returns: series int Number of bars.
isHigherTF(tf, main)
Returns `true` when the selected timeframe represents a
higher resolution than the active timeframe.
Parameters:
tf (string) : series string Selected timeframe.
main (bool) : series bool When `true`, the comparison is made against the chart's main timeframe
instead of the script's active timeframe. Optional. Defaults to `false`.
Returns: series bool `true` if `tf` > active TF; otherwise `false`.
isActiveTF(tf, main)
Returns `true` when the selected timeframe represents the
exact resolution of the active timeframe.
Parameters:
tf (string) : series string Selected timeframe.
main (bool) : series bool When `true`, the comparison is made against the chart's main timeframe
instead of the script's active timeframe. Optional. Defaults to `false`.
Returns: series bool `true` if `tf` == active TF; otherwise `false`.
isLowerTF(tf, main)
Returns `true` when the selected timeframe represents a
lower resolution than the active timeframe.
Parameters:
tf (string) : series string Selected timeframe.
main (bool) : series bool When `true`, the comparison is made against the chart's main timeframe
instead of the script's active timeframe. Optional. Defaults to `false`.
Returns: series bool `true` if `tf` < active TF; otherwise `false`.
isMultipleTF(tf)
Returns `true` if the selected timeframe (`tf`) is a practical multiple
of the active skript's timeframe. It verifies this by checking if `tf` is a higher timeframe
that has consistently contained more than one bar of the skript's timeframe in recent periods.
The period detection is session-aware.
Parameters:
tf (string) : series string The higher timeframe to check.
Returns: series bool `true` if `tf` is a practical multiple; otherwise `false`.
interpTimestamp(offStart, offEnd, pct)
Calculates a precise absolute timestamp by interpolating within a bar range based on a percentage.
This version works with RELATIVE bar offsets from the current bar.
Parameters:
offStart (int) : series int The relative offset of the starting bar (e.g., 10 for 10 bars ago).
offEnd (int) : series int The relative offset of the ending bar (e.g., 1 for 1 bar ago). Must be <= offStart.
pct (float) : series float The percentage of the bar range to measure (e.g., 50.5 for 50.5%).
Values are clamped to the range.
Returns: series int The calculated, interpolated absolute Unix timestamp in milliseconds.

Order Block Overlapping Drawing [TradingFinder]🔵 Introduction
Technical analysis is a fundamental tool in financial markets, helping traders identify key areas on price charts to make informed trading decisions. The ICT (Inner Circle Trader) style, developed by Michael Huddleston, is one of the most advanced methods in this field.
It enables traders to precisely identify and exploit critical zones such as Order Blocks, Breaker Blocks, Fair Value Gaps (FVGs), and Inversion Fair Value Gaps (IFVGs).
To streamline and simplify the use of these key areas, a library has been developed in Pine Script, the scripting language for the TradingView platform. This library allows you to automatically detect overlapping zones between Order Blocks and other similar areas, and visually display them on your chart.
This tool is particularly useful for creating indicators like Balanced Price Range (BPR) and ICT Unicorn Model.
🔵 How to Use
This section explains how to use the Pine Script library. This library assists you in easily identifying and analyzing overlapping areas between Order Blocks and other zones, such as Breaker Blocks and Fair Value Gaps.
To add "Order Block Overlapping Drawing", you must first add the following code to your script.
import TFlab/OrderBlockOverlappingDrawing/1
🟣 Inputs
The library includes the "OBOverlappingDrawing" function, which you can use to detect and display overlapping zones. This function identifies and draws overlapping zones based on the Order Block type, trigger conditions, previous and current prices, and other relevant parameters.
🟣 Parameters
OBOverlappingDrawing(OBType , TriggerConditionOrigin, distalPrice_Pre, proximalPrice_Pre , distalPrice_Curr, proximalPrice_Curr, Index_Curr , OBValidGlobal, OBValidDis, MitigationLvL, ShowAll, Show, ColorZone) =>
OBType (string)
TriggerConditionOrigin (bool)
distalPrice_Pre (float)
proximalPrice_Pre (float)
distalPrice_Curr (float)
proximalPrice_Curr (float)
Index_Curr (int)
OBValidGlobal (bool)
OBValidDis (int)
MitigationLvL (string)
ShowAll (bool)
Show (bool)
ColorZone (color)
In this example, various parameters are defined to detect overlapping zones and draw them on the chart. Based on these settings, the overlapping areas will be automatically drawn on the chart.
OBType : All order blocks are summarized into two types: "Supply" and "Demand." You should input your Current order block type in this parameter. Enter "Demand" for drawing demand zones and "Supply" for drawing supply zones.
TriggerConditionOrigin : Input the condition under which you want the Current order block to be drawn in this parameter.
distalPrice_Pre : Generally, if each zone is formed by two lines, the farthest line from the price is termed Pervious "Distal." This input receives the price of the "Distal" line.
proximalPrice_Pre : Generally, if each zone is formed by two lines, the nearest line to the price is termed Previous "Proximal" line.
distalPrice_Curr : Generally, if each zone is formed by two lines, the farthest line from the price is termed Current "Distal." This input receives the price of the "Distal" line.
proximalPrice_Curr : Generally, if each zone is formed by two lines, the nearest line to the price is termed Current "Proximal" line.
Index_Curr : This input receives the value of the "bar_index" at the beginning of the order block. You should store the "bar_index" value at the occurrence of the condition for the Current order block to be drawn and input it here.
OBValidGlobal : This parameter is a boolean in which you can enter the condition that you want to execute to stop drawing the block order. If you do not have a special condition, you should set it to True.
OBValidDis : Order blocks continue to be drawn until a new order block is drawn or the order block is "Mitigate." You can specify how many candles after their initiation order blocks should continue. If you want no limitation, enter the number 4998.
MitigationLvL : This parameter is a string. Its inputs are one of "Proximal", "Distal" or "50 % OB" modes, which you can enter according to your needs. The "50 % OB" line is the middle line between distal and proximal.
ShowAll : This is a boolean parameter, if it is "true" the entire order of blocks will be displayed, and if it is "false" only the last block order will be displayed.
Show : You may need to manage whether to display or hide order blocks. When this input is "On", order blocks are displayed, and when it's "Off", order blocks are not displayed.
ColorZone : You can input your preferred color for drawing order blocks.
🟣 Output
Mitigation Alerts : This library allows you to leverage Mitigation Alerts to detect specific conditions that could lead to trend reversals. These alerts help you react promptly in your trades, ensuring better management of market shifts.
🔵 Conclusion
The Pine Script library provided is a powerful tool for technical analysis, especially in the ICT style. It enables you to detect overlapping zones between Order Blocks and other significant areas like Breaker Blocks and Fair Value Gaps, improving your trading strategies. By utilizing this tool, you can perform more precise analysis and manage risks effectively in your trades.

ZigZag█ OVERVIEW
This library is a Pine Script™ programmer’s tool containing custom user-defined types and functions to calculate Zig Zag indicators within their scripts. It is not a stand-alone indicator.
Pine Script™ libraries are publications that contain reusable code for importing into Pine Script™ indicators, strategies, and other libraries. For more information on libraries and incorporating them into your scripts, see the Libraries section of the Pine Script™ User Manual .
█ CONCEPTS
Zig Zag
Zig Zag is a popular indicator that filters out minor price fluctuations to denoise data and emphasize trends. Traders commonly use Zig Zag for trend confirmation, identifying potential support and resistance, and pattern detection. It is formed by identifying significant local high and low points in alternating order and connecting them with straight lines, omitting all other data points from their output. There are several ways to calculate the Zig Zag's data points and the conditions by which its direction changes. This script uses pivots as the data points, which are the highest or lowest values over a defined number of bars before and after them. The direction only reverses when a newly formed pivot deviates from the last Zig Zag point in the opposite direction by an amount greater than or equal to a specified percentage.
To learn more about Zig Zag and how to calculate it, see this entry from the Help Center.
█ FOR Pine Script™ CODERS
Notes
This script's architecture utilizes user-defined types (UDTs) to create custom objects which are the equivalent of variables containing multiple parts, each able to hold independent values of different types . UDTs are the newest addition to Pine Script™ and the most advanced feature the language has seen to date. The feature's introduction creates a new runway for experienced coders to push the boundaries of Pine. We recommend that newcomers to the language explore the basics first before diving into UDTs and objects.
Demonstration Code
Our example code shows a simple use case by displaying a Zig Zag with user-defined settings. A new ZigZag object is instantiated on the first bar using a Settings object to control its attributes. The fields for the Settings object are declared using variables assigned to input.* functions, allowing control of the field values from the script's settings. The `update()` function is invoked on each bar to update the ZigZag object's fields and create new lines and labels when required.
Look first. Then leap.
█ TYPES
This library contains the following types:
Settings
Provides calculation and display attributes to ZigZag objects.
Fields:
devThreshold : The minimum percentage deviation from a point before the ZigZag will change direction.
depth : The number of bars required for pivot detection.
lineColor : Line color.
extendLast : Condition allowing a line to connect the most recent pivot with the current close.
displayReversalPrice : Condition to display the pivot price in the pivot label.
displayCumulativeVolume : Condition to display the cumulative volume for the pivot segment in the pivot label.
displayReversalPriceChange : Condition to display the change in price or percent from the previous pivot in the pivot label.
differencePriceMode : Reversal change display mode. Options are "Absolute" or "Percent".
draw : Condition to display lines and labels.
Point
A coordinate containing time and price information.
Fields:
tm : A value in UNIX time.
price : A value on the Y axis (price).
Pivot
A level of significance used to determine directional movement or potential support and resistance.
Fields:
ln : A line object connecting the `start` and `end` Point objects.
lb : A label object to display pivot values.
isHigh : A condition to determine if the pivot is a pivot high.
vol : Volume for the pivot segment.
start : The coordinate of the previous Point.
end : The coordinate of the current Point.
ZigZag
An object to maintain Zig Zag settings, pivots, and volume.
Fields:
settings : Settings object to provide calculation and display attributes.
pivots : An array of Pivot objects.
sumVol : The volume sum for the pivot segment.
extend : Pivot object used to project a line from the last pivot to the last bar.
█ FUNCTIONS
This library contains the following functions:
lastPivot(this)
Returns the last Pivot of `this` ZigZag if there is at least one Pivot to return, and `na` otherwise.
Parameters:
this : (series ZigZag) A ZigZag object.
Returns: (Pivot) The last Pivot in the ZigZag.
update(this)
Updates `this` ZigZag object with new pivots, volume, lines, labels.
Parameters:
this : (series ZigZag) a ZigZag object.
Returns: (bool) true if a new Zig Zag line is found or the last Zig Zag line has changed.
newInstance(settings)
Instantiates a new ZigZag object with `settings`. If no settings are provided, a default ZigZag object is created.
Parameters:
settings : (series Settings) A Settings object.
Returns: (ZigZag) A new ZigZag instance.

Material Color Palette Library█ OVERVIEW
Unlock a world of color in your Pine Script® projects with the Material Color Palette Library . This library provides a comprehensive and structured color system based on Google's Material Design palette, making it incredibly easy to create visually appealing and professional-looking indicators and strategies.
Forget about guessing hex codes. With this library, you have access to 19 distinct color families, each offering a wide range of shades. Every color can be fine-tuned with saturation, darkness, and opacity levels, giving you precise control over your script's appearance.
To make development even easier, the library includes a visual cheatsheet. Simply add the script to your chart to display a full table of all available colors and their corresponding parameters.
█ KEY FEATURES
Vast Spectrum: 19 distinct color families, from vibrant reds and blues to subtle greys and browns.
Fine-Tuned Control: Each color function accepts parameters for `saturationLevel` (1-13 or 1-9) and `darkLevel` (1-3) to select the perfect shade.
Opacity Parameter: Easily add transparency to any color for fills, backgrounds, or lines.
Quick Access Tones: A simple `tone()` function to grab base colors by name.
Visual Cheatsheet: An on-chart table displays the entire color palette, serving as a handy reference guide during development.
█ HOW TO USE
As a library, this script is meant to be imported into your own indicators or strategies.
1. Import the Library
Add the following line to the top of your script. Remember to replace `YourUsername` with your TradingView username.
import mastertop/ColorPalette/1 as colors
2. Call a Color Function
You can now use any of the exported functions to set colors for your plots, backgrounds, tables, and more.
The primary functions take three arguments: `functionName(saturationLevel, darkLevel, opacity)`
`saturationLevel`: An integer that controls the intensity of the color. Ranges from 1 (lightest) to 13 (most vibrant) for most colors, and 1-9 for `brown`, `grey`, and `blueGrey`.
`darkLevel`: An integer from 1 to 3 (1: light, 2: medium, 3: dark).
`opacity`: An integer from 0 (opaque) to 100 (invisible).
Example Usage:
Let's plot a moving average with a specific shade of teal.
// Import the library
import mastertop/ColorPalette/1 as colors
indicator("My Script with Custom Colors", overlay = true)
// Calculate a moving average
ma = ta.sma(close, 20)
// Plot the MA using a color from the library
// We'll use teal with saturation level 7, dark level 2, and 0% opacity
plot(ma, "MA", color = colors.teal(7, 2, 0), linewidth = 2)
3. Using the `tone()` Function
For quick access to a base color, you can use the `tone()` function.
// Set a red background with 85% transparency
bgcolor(colors.tone('red', 85))
█ VISUAL REFERENCE
To see all available colors at a glance, you can add this library script directly to your chart. It will display a comprehensive table showing every color variant. This makes it easy to pick the exact shade you need without guesswork.
This library is designed for fellow Pine Script® developers to streamline their workflow and enhance the visual quality of their scripts. Enjoy!
logLibrary "log"
Logging library for easily displaying debug, info, warn, error and critical messages.
No real need to explain why you might want to use this library! I'm sure you've all experienced the frustration of trying to understand the data state of your scripts... so, enjoy! More on it's way...
(Don't forget to check the helpers in the script and the useful tips below)
Some Useful Tips
By default the log console persists between bars (for history) and bars and ticks (for realtime).
Sometimes it is useful to clear the log after each candle or tick (assuming we are using the above helpers):
```
log_print(clear = true) // starts afresh on every bar and tick (excludes historical bars but good realtime tick analysis)
log_print(clear = barstate.isnew) // clears the log at the start of each bar (again, excludes historical but good realtime candle analysis)
```
It is also useful to be able to selectively understand the state of data at specific points or times within a script:
```
if log.once()
debug('useful variable', my_var) // this log only gets written once, upon first execution of this statement
if log.only(5)
debug3(a, b, c) // these variables are only logged the first five times this statement is executed
log_print(clear = false) // clear must be false and you should not write other logs on every bar, or the above will be lost
```
Final tip. If you want to view ONLY log entries of a particular level, then negate the constant:
```
log_print(level = -LOG_DEBUG)
```
Detailed Interface
once() Restrict execution to only happen once. Usage: if assert.once()\n happens_once()
Returns: bool, true on first execution within scope, false subsequently
only(repeat) Restrict execution to happen a set number of times. Usage: if assert.only(5)\n happens_five_times()
Parameters:
repeat : int, the number of times to return true
Returns: bool, true for the set number of times within scope, false subsequently
init() Initialises the log array
Returns: string , tuple based array to contain all pending log entries (__LOG)
clear(msgs) Clears the log array
Parameters:
msgs : string , the current collection of unfiltered and unprocessed logs (__LOG)
trace(msgs, msg) Writes a trace message to the log console
Parameters:
msgs : string , the current collection of unfiltered and unprocessed logs (__LOG)
msg : string, the trace message to write to the log
debug(msgs, msg) Writes a debug message to the log console
Parameters:
msgs : string , the current collection of unfiltered and unprocessed logs (__LOG)
msg : string, the debug message to write to the log
info(msgs, msg) Writes an info message to the log console
Parameters:
msgs : string , the current collection of unfiltered and unprocessed logs (__LOG)
msg : string, the info message to write to the log
warn(msgs, msg) Writes a warning message to the log console
Parameters:
msgs : string , the current collection of unfiltered and unprocessed logs (__LOG)
msg : string, the warn message to write to the log
error(msgs, msg) Writes an error message to the log console
Parameters:
msgs : string , the current collection of unfiltered and unprocessed logs (__LOG)
msg : string, the error message to write to the log
fatal(msgs, msg) Writes a critical message to the log console
Parameters:
msgs : string , the current collection of unfiltered and unprocessed logs (__LOG)
msg : string, the fatal message to write to the log
log(msgs, level, msg) Write a log message to the log console with a custom level
Parameters:
msgs : string , the current collection of unfiltered and unprocessed logs (__LOG)
level : ing, the logging level to assign to the message
msg : string, the log message to write to the log
severity(msgs) Checks the unprocessed log messages and returns the highest present level
Parameters:
msgs : string , the current collection of unfiltered and unprocessed logs (__LOG)
Returns: int, the highest level found within the unfiltered logs
print(msgs, level, clear, rows, text_size, position) Prints all log messages to the screen
Parameters:
msgs : string , the current collection of unfiltered and unprocessed logs (__LOG)
level : int, the minimum required log level of each message to be displayed
clear : bool, clear the printed log console after each render (useful with realtime when set to barstate.isconfirmed)
rows : int, the number of rows to display in the log console
text_size : string, the text size of the log console (global size vars)
position : string, the position of the log console (global position vars)
unittest_log(case) Log module unit tests, for inclusion in parent script test suite. Usage: log.unittest_log(__ASSERTS)
Parameters:
case : string , the current test case and array of previous unit tests (__ASSERTS)
unittest(verbose) Run the log module unit tests as a stand alone. Usage: log.unittest()
Parameters:
verbose : bool, optionally disable the full report to only display failures

assertLibrary "assert"
Production ready assertions and auto-reporting for unit testing pine scripts.
This library was born from the need to maintain production level stability and catch regressions / bugs early and fast. I hope this help you trust your pine scripts too. More libraries and tools on their way... please follow for more.
Please see the script for helpers to copy into your own scripts as well as examples at the bottom of the library unit testing itself.
Quick Reference
```
case = assert.init()
new_case(case, 'Asserts for floats and ints')
assert.equal(a, b, case, 'a == b')
assert.not_equal(a, b, case, 'a != b')
assert.nan(a, case, 'a == na')
assert.not_nan(a, case, 'a != na')
assert.is_in(a, b, case, 'a in b ')
assert.is_not_in(a, b, case, 'a not in b ')
assert.array_equal(a, b, case, 'a == b ')
new_case(case, 'Asserts for ints only')
assert.int_in(a, b, case, 'a in b ')
assert.int_not_in(a, b, case, 'a not in b ')
assert.int_array_equal(a, b, case, 'a == b ')
new_case(case, 'Asserts for bools only')
assert.is_true(a, case, 'a == true')
assert.is_false(a, case, 'a == false')
assert.bool_equal(a, b, case, 'a == b')
assert.bool_not_equal(a, b, case, 'a != b')
assert.bool_nan(a, case, 'a == na')
assert.bool_not_nan(a, case, 'a != na')
assert.bool_array_equal(a, b, case, 'a == b ')
new_case(case, 'Asserts for strings only')
assert.str_equal(a, b, case, 'a == b')
assert.str_not_equal(a, b, case, 'a != b')
assert.str_nan(a, case, 'a == na')
assert.str_not_nan(a, case, 'a != na')
assert.str_in(a, b, case, 'a in b ')
assert.str_not_in(a, b, case, 'a not in b ')
assert.str_array_equal(a, b, case, 'a == b ')
assert.report(case)
```
Detailed Interface
once() Restrict execution to only happen once. Usage: if assert.once()\n happens_once()
Returns: bool, true on first execution within scope, false subsequently
init() Initialises the asserts array
Returns: string , tuple based array containing all unit test results and current case details (__ASSERTS)
equal(a, b, case, name) Numeric assert equal. Usage: assert.equal(1, 1, case, 'one == one')
Parameters:
a : float, numeric value "a" to compare equal to "b"
b : float, numeric value "b" to compare equal to "a"
case : string , the current test case and array of previous unit tests (__ASSERTS)
name : string, the current unit test name, if undefined the test index of the current case is used
Returns: bool, true if the assertion passes, false otherwise
not_equal(a, b, case, name) Numeric assert not equal. Usage: assert.not_equal(1, 2, case, 'one != two')
Parameters:
a : float, numeric value "a" to compare not equal "b"
b : float, numeric value "b" to compare not equal "a"
case : string , the current test case and array of previous unit tests (__ASSERTS)
name : string, the current unit test name, if undefined the test index of the current case is used
Returns: bool, true if the assertion passes, false otherwise
nan(a, case, name) Numeric assert is NaN. Usage: assert.nan(float(na), case, 'number is NaN')
Parameters:
a : float, numeric value "a" to check is NaN
case : string , the current test case and array of previous unit tests (__ASSERTS)
name : string, the current unit test name, if undefined the test index of the current case is used
Returns: bool, true if the assertion passes, false otherwise
not_nan(a, case, name) Numeric assert is not NaN. Usage: assert.not_nan(1, case, 'number is not NaN')
Parameters:
a : float, numeric value "a" to check is not NaN
case : string , the current test case and array of previous unit tests (__ASSERTS)
name : string, the current unit test name, if undefined the test index of the current case is used
Returns: bool, true if the assertion passes, false otherwise
is_in(a, b, case, name) Numeric assert value in float array. Usage: assert.is_in(1, array.from(1.0), case, '1 is in ')
Parameters:
a : float, numeric value "a" to check is in array "b"
b : float , array "b" to check contains "a"
case : string , the current test case and array of previous unit tests (__ASSERTS)
name : string, the current unit test name, if undefined the test index of the current case is used
Returns: bool, true if the assertion passes, false otherwise
is_not_in(a, b, case, name) Numeric assert value not in float array. Usage: assert.is_not_in(2, array.from(1.0), case, '2 is not in ')
Parameters:
a : float, numeric value "a" to check is not in array "b"
b : float , array "b" to check does not contain "a"
case : string , the current test case and array of previous unit tests (__ASSERTS)
name : string, the current unit test name, if undefined the test index of the current case is used
Returns: bool, true if the assertion passes, false otherwise
array_equal(a, b, case, name) Float assert arrays are equal. Usage: assert.array_equal(array.from(1.0), array.from(1.0), case, ' == ')
Parameters:
a : float , array "a" to check is identical to array "b"
b : float , array "b" to check is identical to array "a"
case : string , the current test case and array of previous unit tests (__ASSERTS)
name : string, the current unit test name, if undefined the test index of the current case is used
Returns: bool, true if the assertion passes, false otherwise
int_in(a, b, case, name) Integer assert value in integer array. Usage: assert.int_in(1, array.from(1), case, '1 is in ')
Parameters:
a : int, value "a" to check is in array "b"
b : int , array "b" to check contains "a"
case : string , the current test case and array of previous unit tests (__ASSERTS)
name : string, the current unit test name, if undefined the test index of the current case is used
Returns: bool, true if the assertion passes, false otherwise
int_not_in(a, b, case, name) Integer assert value not in integer array. Usage: assert.int_not_in(2, array.from(1), case, '2 is not in ')
Parameters:
a : int, value "a" to check is not in array "b"
b : int , array "b" to check does not contain "a"
case : string , the current test case and array of previous unit tests (__ASSERTS)
name : string, the current unit test name, if undefined the test index of the current case is used
Returns: bool, true if the assertion passes, false otherwise
int_array_equal(a, b, case, name) Integer assert arrays are equal. Usage: assert.int_array_equal(array.from(1), array.from(1), case, ' == ')
Parameters:
a : int , array "a" to check is identical to array "b"
b : int , array "b" to check is identical to array "a"
case : string , the current test case and array of previous unit tests (__ASSERTS)
name : string, the current unit test name, if undefined the test index of the current case is used
Returns: bool, true if the assertion passes, false otherwise
is_true(a, case, name) Boolean assert is true. Usage: assert.is_true(true, case, 'is true')
Parameters:
a : bool, value "a" to check is true
case : string , the current test case and array of previous unit tests (__ASSERTS)
name : string, the current unit test name, if undefined the test index of the current case is used
Returns: bool, true if the assertion passes, false otherwise
is_false(a, case, name) Boolean assert is false. Usage: assert.is_false(false, case, 'is false')
Parameters:
a : bool, value "a" to check is false
case : string , the current test case and array of previous unit tests (__ASSERTS)
name : string, the current unit test name, if undefined the test index of the current case is used
Returns: bool, true if the assertion passes, false otherwise
bool_equal(a, b, case, name) Boolean assert equal. Usage: assert.bool_equal(true, true, case, 'true == true')
Parameters:
a : bool, value "a" to compare equal to "b"
b : bool, value "b" to compare equal to "a"
case : string , the current test case and array of previous unit tests (__ASSERTS)
name : string, the current unit test name, if undefined the test index of the current case is used
Returns: bool, true if the assertion passes, false otherwise
bool_not_equal(a, b, case, name) Boolean assert not equal. Usage: assert.bool_not_equal(true, false, case, 'true != false')
Parameters:
a : bool, value "a" to compare not equal "b"
b : bool, value "b" to compare not equal "a"
case : string , the current test case and array of previous unit tests (__ASSERTS)
name : string, the current unit test name, if undefined the test index of the current case is used
Returns: bool, true if the assertion passes, false otherwise
bool_nan(a, case, name) Boolean assert is NaN. Usage: assert.bool_nan(bool(na), case, 'bool is NaN')
Parameters:
a : bool, value "a" to check is NaN
case : string , the current test case and array of previous unit tests (__ASSERTS)
name : string, the current unit test name, if undefined the test index of the current case is used
Returns: bool, true if the assertion passes, false otherwise
bool_not_nan(a, case, name) Boolean assert is not NaN. Usage: assert.bool_not_nan(true, case, 'bool is not NaN')
Parameters:
a : bool, value "a" to check is not NaN
case : string , the current test case and array of previous unit tests (__ASSERTS)
name : string, the current unit test name, if undefined the test index of the current case is used
Returns: bool, true if the assertion passes, false otherwise
bool_array_equal(a, b, case, name) Boolean assert arrays are equal. Usage: assert.bool_array_equal(array.from(true), array.from(true), case, ' == ')
Parameters:
a : bool , array "a" to check is identical to array "b"
b : bool , array "b" to check is identical to array "a"
case : string , the current test case and array of previous unit tests (__ASSERTS)
name : string, the current unit test name, if undefined the test index of the current case is used
Returns: bool, true if the assertion passes, false otherwise
str_equal(a, b, case, name) String assert equal. Usage: assert.str_equal('hi', 'hi', case, '"hi" == "hi"')
Parameters:
a : string, value "a" to compare equal to "b"
b : string, value "b" to compare equal to "a"
case : string , the current test case and array of previous unit tests (__ASSERTS)
name : string, the current unit test name, if undefined the test index of the current case is used
Returns: bool, true if the assertion passes, false otherwise
str_not_equal(a, b, case, name) String assert not equal. Usage: assert.str_not_equal('hi', 'bye', case, '"hi" != "bye"')
Parameters:
a : string, value "a" to compare not equal "b"
b : string, value "b" to compare not equal "a"
case : string , the current test case and array of previous unit tests (__ASSERTS)
name : string, the current unit test name, if undefined the test index of the current case is used
Returns: bool, true if the assertion passes, false otherwise
str_nan(a, case, name) String assert is NaN. Usage: assert.str_nan(string(na), case, 'string is NaN')
Parameters:
a : string, value "a" to check is NaN
case : string , the current test case and array of previous unit tests (__ASSERTS)
name : string, the current unit test name, if undefined the test index of the current case is used
Returns: bool, true if the assertion passes, false otherwise
str_not_nan(a, case, name) String assert is not NaN. Usage: assert.str_not_nan('hi', case', 'string is not NaN')
Parameters:
a : string, value "a" to check is not NaN
case : string , the current test case and array of previous unit tests (__ASSERTS)
name : string, the current unit test name, if undefined the test index of the current case is used
Returns: bool, true if the assertion passes, false otherwise
str_in(a, b, case, name) String assert value in string array. Usage: assert.str_in('hi', array.from('hi'), case, '"hi" in ')
Parameters:
a : string, value "a" to check is in array "b"
b : string , array "b" to check contains "a"
case : string , the current test case and array of previous unit tests (__ASSERTS)
name : string, the current unit test name, if undefined the test index of the current case is used
Returns: bool, true if the assertion passes, false otherwise
str_not_in(a, b, case, name) String assert value not in string array. Usage: assert.str_in('hi', array.from('bye'), case, '"hi" in ')
Parameters:
a : string, value "a" to check is not in array "b"
b : string , array "b" to check does not contain "a"
case : string , the current test case and array of previous unit tests (__ASSERTS)
name : string, the current unit test name, if undefined the test index of the current case is used
Returns: bool, true if the assertion passes, false otherwise
str_array_equal(a, b, case, name) String assert arrays are equal. Usage: assert.str_array_equal(array.from('hi'), array.from('hi'), case, ' == ')
Parameters:
a : string , array "a" to check is identical to array "b"
b : string , array "b" to check is identical to array "a"
case : string , the current test case and array of previous unit tests (__ASSERTS)
name : string, the current unit test name, if undefined the test index of the current case is used
Returns: bool, true if the assertion passes, false otherwise
new_case(case, name) Assign a new test case name, for the next set of unit tests. Usage: assert.new_case(case, 'My tests')
Parameters:
case : string , the current test case and array of previous unit tests (__ASSERTS)
name : string, the case name for the next suite of tests
clear(case) Clear all stored unit tests from all cases. Usage: assert.clear(case)
Parameters:
case : string , the current test case and array of previous unit tests (__ASSERTS)
revert(case) Revert the previous unit test. Usage: = assert.revert(case)
Parameters:
case : string , the current test case and array of previous unit tests (__ASSERTS)
Returns: , tuple containing the msg and result of the reverted test
passed(case, revert) Check if the last unit test has passed. Usage: bool success = assert.passed(case)
Parameters:
case : string , the current test case and array of previous unit tests (__ASSERTS)
revert : bool, optionally revert the test
Returns: bool, true only if the test passed
failed(case, revert) Check if the last unit test has failed. Usage: bool failure = assert.failed(case)
Parameters:
case : string , the current test case and array of previous unit tests (__ASSERTS)
revert : bool, optionally revert the test
Returns: bool, true only if the test failed
report(case, verbose) Report the outcome of unit tests that fail. Usage: bool passed = assert.report(case)
Parameters:
case : string , the current test case and array of previous unit tests (__ASSERTS)
verbose : bool, optionally display full report that includes the outcome of all tests
Returns: bool, true only if all tests passed
unittest_assert(case) Assert module unit tests, for inclusion in parent script test suite. Usage: assert.unittest_assert(__ASSERTS)
Parameters:
case : string , the current test case and array of previous unit tests (__ASSERTS)
unittest(verbose) Run the assert module unit tests as a stand alone. Usage: assert.unittest()
Parameters:
verbose : bool, optionally toggle report to display the outcome of all unit tests

CommonUtils█ OVERVIEW
This library is a utility tool for Pine Script™ developers. It provides a collection of helper functions designed to simplify common tasks such as mapping user-friendly string inputs to Pine Script™ constants and formatting timeframe strings for display. The primary goal is to make main scripts cleaner, more readable, and reduce repetitive boilerplate code. It is envisioned as an evolving resource, with potential for new utilities to be added over time based on community needs and feedback.
█ CONCEPTS
The library primarily focuses on two main concepts:
Input Mapping
Pine Script™ often requires specific constants for function parameters (e.g., `line.style_dashed` for line styles, `position.top_center` for table positions). However, presenting these technical constants directly to users in script inputs can be confusing. Input mapping involves:
Allowing users to select options from more descriptive, human-readable strings (e.g., "Dashed", "Top Center") in the script's settings.
Providing functions within this library (e.g., `mapLineStyle`, `mapTablePosition`) that take these user-friendly strings as input.
Internally, these functions use switch statements or similar logic to convert (map) the input string to the corresponding Pine Script™ constant required by built-in functions.
This approach enhances user experience and simplifies the main script's logic by centralizing the mapping process.
Timeframe Formatting
Raw timeframe strings obtained from variables like `timeframe.period` (e.g., "1", "60", "D", "W") or user inputs are not always ideal for direct display in labels or panels. The `formatTimeframe` function addresses this by:
Taking a raw timeframe string as input.
Parsing this string to identify its numerical part and unit (e.g., minutes, hours, days, weeks, months, seconds, milliseconds).
Converting it into a more standardized and readable format (e.g., "1min", "60min", "Daily", "Weekly", "1s", "10M").
Offering an optional `customSuffix` parameter (e.g., " FVG", " Period") to append to the formatted string, making labels more descriptive, especially in multi-timeframe contexts.
The function is designed to correctly interpret various common timeframe notations used in TradingView.
█ NOTES
Ease of Use: The library functions are designed with simple and understandable signatures. They typically take a string input and return the corresponding Pine Script™ constant or a formatted string.
Default Behaviors: Mapping functions (`mapLineStyle`, `mapTablePosition`, `mapTextSize`) generally return a sensible default value (e.g., `line.style_solid` for `mapLineStyle`) in case of a non-matching input. This helps prevent errors in the main script.
Extensibility of Formatting: The `formatTimeframe` function, with its `customSuffix` parameter, allows for flexible customization of timeframe labels to suit the specific descriptive needs of different indicators or contexts.
Performance Considerations: These utility functions primarily use basic string operations and switch statements. For typical use cases, their impact on overall script performance is negligible. However, if a function like `formatTimeframe` were to be called excessively in a loop with dynamic inputs (which is generally not its intended use), performance should be monitored.
No Dependencies: This library is self-contained and does not depend on any other external Pine Script™ libraries.
█ EXPORTED FUNCTIONS
mapLineStyle(styleString)
Maps a user-provided line style string to its corresponding Pine Script™ line style constant.
Parameters:
styleString (simple string) : The input string representing the desired line style (e.g., "Solid", "Dashed", "Dotted" - typically from constants like LS1, LS2, LS3).
Returns: The Pine Script™ constant for the line style (e.g., line.style_solid). Defaults to line.style_solid if no match.
mapTablePosition(positionString)
Maps a user-provided table position string to its corresponding Pine Script™ position constant.
Parameters:
positionString (simple string) : The input string representing the desired table position (e.g., "Top Right", "Top Center" - typically from constants like PP1, PP2).
Returns: The Pine Script™ constant for the table position (e.g., position.top_right). Defaults to position.top_right if no match.
mapTextSize(sizeString)
Maps a user-provided text size string to its corresponding Pine Script™ size constant.
Parameters:
sizeString (simple string) : The input string representing the desired text size (e.g., "Tiny", "Small" - typically from constants like PTS1, PTS2).
Returns: The Pine Script™ constant for the text size (e.g., size.tiny). Defaults to size.small if no match.
formatTimeframe(tfInput, customSuffix)
Formats a raw timeframe string into a more display-friendly string, optionally appending a custom suffix.
Parameters:
tfInput (simple string) : The raw timeframe string from user input or timeframe.period (e.g., "1", "60", "D", "W", "1S", "10M", "2H").
customSuffix (simple string) : An optional suffix to append to the formatted timeframe string (e.g., " FVG", " Period"). Defaults to an empty string.
Returns: The formatted timeframe string (e.g., "1min", "60min", "Daily", "Weekly", "1s", "10min", "2h") with the custom suffix appended.

MTFindicatorsQuite recently TradingView added the possibility to create and use Libraries in PineScript. With this feature PineScript became higher quality of coding language overnight. Libraries enable splitting your code into multiple files, providing easier access to code reusability.
I was working on a script which included 3000 lines of code, which was recompiling 1:30 min, and recalculating over 1 minute as well. So I split it into 2 parts: main part + library containing "main logic", which I reuse in variety of scripts, but don't change too often. Result? Now recompilation of my main script takes 10 and recalculation 8 seconds!!!. I instantly fell in love with libraries.
Having said that, and being dedicated hater of security() calls, I have decided to publish a library of MTF indicators created with my own approach: "dig into formula". I have explained reasons for such approach in desription to this script:
So this library script will be a set of indicators reaching to higher timeframes. Just include one line at the beginning of the script you are creating:
import Peter_O/MTFindicators/1 as LIB
and then somewhere is the code add this line:
rsimtf=LIB.rsi_mtf(close,5,14)
All of a sudden you have access to rsimtf from 5x higher timeframe without any hassle :)
I start with RSI MTF, next ones will be ADX, Stochastic and some more. I will update this library with them here as well. Feel free to request particular indicators in comments. Maybe PSAR? Maybe Bollinger Bands?
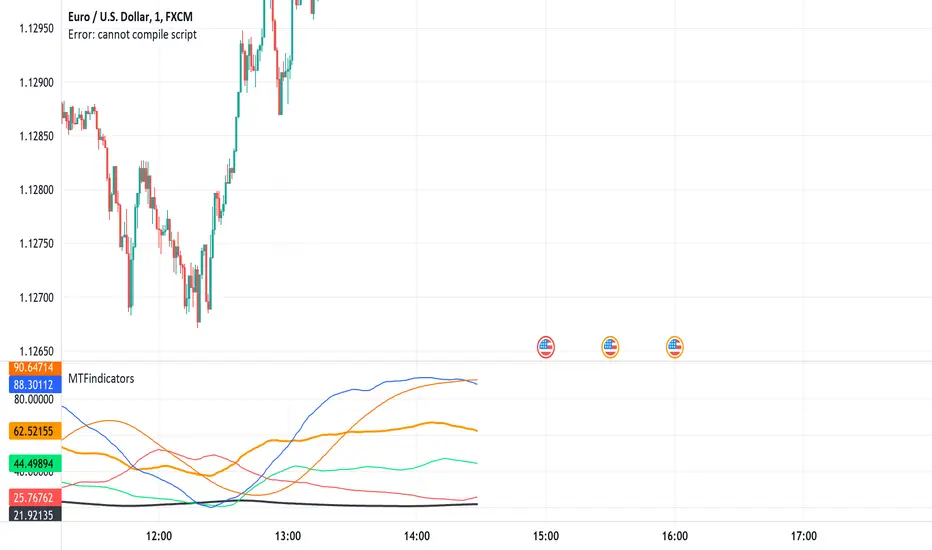
A_Taders_Edge_LIBRARYLibrary "A_Taders_Edge_LIBRARY"
RCI(_rciLength, _close, _interval, _outerMostRangeOfOscillator)
- You will see me using this a lot. DEFINITELY my favorite oscillator to utilize for SO many different things from timing entries/exits to determining trends.
Parameters:
_rciLength (int)
_close (float)
_interval (int)
_outerMostRangeOfOscillator (int)
Returns: - Outputs a single RCI value that will between (-)_outerMostRangeOfOscillator to (+)_outerMostRangeOfOscillator
InvalidTID(_close, _showInvalidAssets, _securityTickerid, _invalidArray)
- This is to add a table on the right of your chart that prints all the TickerID's that were either not formulated correctly in the scripts input or that is not a valid symbol and should be changed.
Parameters:
_close (float)
_showInvalidAssets (simple bool)
_securityTickerid (string)
_invalidArray (string )
Returns: - Does NOT return a value but rather the table with the invalid TickerID's from the scripts input that need to be changed.
LabelLocation(_firstLocation)
- This is ONLY for when you are wanting to print ALERT LABELS with the assets name for when an alert trigger occurs for that asset. There are a total of 40 assets that can be used in each copy of the script. You don't want labels from different assets printing on top of each other because you will not be able to read the asset name that the label is for. Ex. If you put your _firstLocation in the input settings as 1 and have 40 assets on this copy of the scanner then the first asset in the list is assigned to the location value 1 on the scale, and the 2nd in the list is assigned to location value 2...and so on. If your first location is set to 81 then the 1st asset is 81 and 2nd is 82 and so on.
Parameters:
_firstLocation (simple int)
Returns: - regardless of if you have the maximum amount of assets being screened (40 max), this export function will output 40 locations… So there needs to be 40 variables assigned to the tuple in this export function. What I mean by that is there needs to be 40 variables between the ' '. If you only have 20 assets in your scripts input settings, then only the first 20 variables within the ' ' Will be assigned to a value location and the other 20 will be assigned 'NA'.
SeparateTickerids(_string)
- You must form this single tickerID input string exactly as laid out in the water (a little gray circle at the end of the setting, that you hover your cursor over to read the details of). IF the string is formed correctly then it will break up. All of the tip rate is within the string into a total of 40 separate strings which will be all of the tickerIDs that the script is using in your MO scanner.
Parameters:
_string (simple string)
Returns: - this will output, 40 different security assets within the tuple output (ie. 40 variable within the ' ') regardless of if you were including 40 assets, to be screened in the MO Screener or not. if you have less than 40 assets, then once the variables are assigned to all of the tickerIDs, the rest of the variables will be assigned "NA".
TickeridForLabelsAndSecurity(_includeExchange, _ticker)
- this export function is used to output 2 tickerID strings. One is formulated to properly work in the request.security() function while the other is how it will appear on the asset name labels depending on how you form your assets string in the MO scanners input settings. Review the tooltip next to the setting, to learn how to form the string so that the asset name labels will appear how you want in the labels at the end of the line plots & the alert labels that would be triggered if the MO Scanner is set up to include Alert Trigger Labels.
Parameters:
_includeExchange (simple bool)
_ticker (simple string)
Returns: - this export function is used to output 2 tickerID strings. One is formulated to properly work in the request.security() function while the other is how it will appear on the asset name labels depending on how you form your assets string in the MO scanners input settings. Review the tooltip next to the setting, to learn how to form the string so that the asset name labels will appear how you want in the labels at the end of the line plots & the alert labels that would be triggered if the MO Scanner is set up to include Alert Trigger Labels.
PercentChange(_startingValue, _endingValue)
- this is a quick export function to calculate how much % change has occurred between the _startingValue and the _endingValue that you input into the export function.
Parameters:
_startingValue (float)
_endingValue (float)
Returns: - it will output a single percentage value between 0-100 with trailing numbers behind a decimal. If you want, only a certain amount of numbers behind the decimal, this export function needs to be put within a formatting function to do so. Explained in the MO Scanner INTRO VIDEO.
PrintedBarCount(_time, _barCntLength, _bcPmin)
- This export function will outfit the percentage of printed bars (that occurred within _barCntLength amount of time) out of the MAX amount of bars that potentially COULD HAVE been printed. Iexplanation in the MO Scanner INTRO VIDEO.
Parameters:
_time (int)
_barCntLength (int)
_bcPmin (int)
Returns: - Gives 2 outputs. The first is the total % of Printed Bars within the user set time period and second is true/false according to if the Printed BarCount % is above the _bcPmin threshold that you input into this export function.

LibraryStopwatchLibrary "LibraryStopwatch"
Provides functions to time the execution of a script.
When timing scripts, keep in mind that the runtime environment is fluid on TradingView. Different servers or server loads will impact execution time.
Look first. Then leap.
stopwatchStats() Times the execution of a script.
Returns: A tuple of four values: timePerBarInMs, totalTimeInMs, barsTimed, barsNotTimed
stopwatch() Times the execution of a script.
Returns: A single value: The time elapsed since the beginning of the script, in ms.
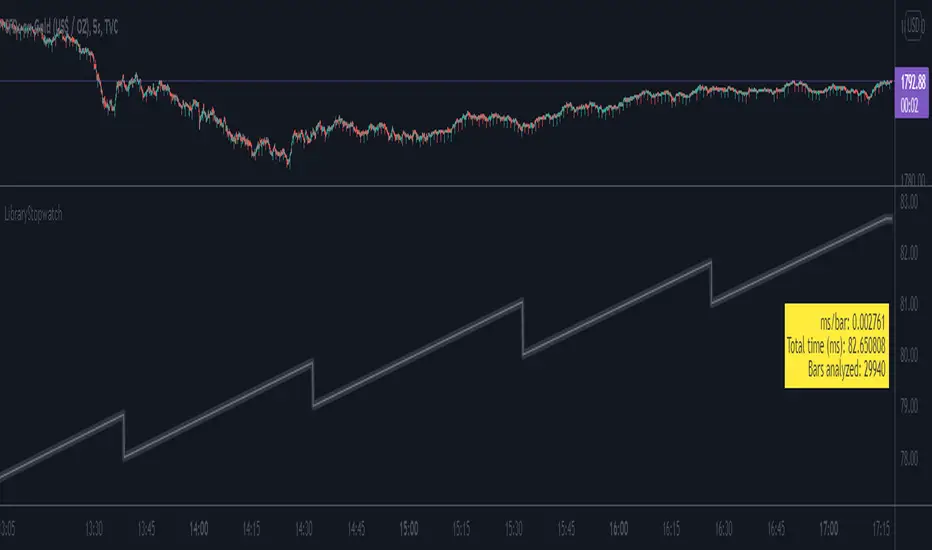
CoreMACDHTF [CHE]Library "CoreMACDHTF"
calc_macd_htf(src, preset_str, smooth_len)
Parameters:
src (float)
preset_str (simple string)
smooth_len (int)
is_hist_rising(src, preset_str, smooth_len)
Parameters:
src (float)
preset_str (simple string)
smooth_len (int)
hist_rising_01(src, preset_str, smooth_len)
Parameters:
src (float)
preset_str (simple string)
smooth_len (int)
CoreMACDHTF — Hardcoded HTF MACD Presets with Smoothed Histogram Regime Flags
Summary
CoreMACDHTF provides a reusable MACD engine that approximates higher-timeframe behavior by selecting hardcoded EMA lengths based on the current chart timeframe, then optionally smoothing the resulting histogram with a stateful filter. It is published as a Pine v6 library but intentionally includes a minimal demo plot so you can validate behavior directly on a chart. The primary exported outputs are MACD, signal, a smoothed histogram, and the resolved lengths plus a timeframe tag. In addition, it exposes a histogram rising condition so importing scripts can reuse the same regime logic instead of re-implementing it.
Motivation: Why this design?
Classic MACD settings are often tuned to one timeframe. When you apply the same parameters to very different chart intervals, the histogram can become either too noisy or too sluggish. This script addresses that by using a fixed mapping from the chart timeframe into a precomputed set of EMA lengths, aiming for more consistent “tempo” across intervals. A second problem is histogram micro-chop around turning points; the included smoother reduces short-run flips so regime-style conditions can be more stable for alerts and filters.
What’s different vs. standard approaches?
Reference baseline: a standard MACD using fixed fast, slow, and signal lengths on the current chart timeframe.
Architecture differences:
Automatic timeframe bucketing that selects a hardcoded length set for the chosen preset.
Two preset families: one labeled A with lengths three, ten, sixteen; one labeled B with lengths twelve, twenty-six, nine.
A custom, stateful histogram smoother intended to damp noisy transitions.
Library exports that return both signals and metadata, plus a dedicated “histogram rising” boolean.
Practical effect:
The MACD lengths change when the chart timeframe changes, so the oscillator’s responsiveness is not constant across intervals by design.
The rising-flag logic is based on the smoothed histogram, which typically reduces single-bar flip noise compared to using the raw histogram directly.
How it works (technical)
1. The script reads the chart timeframe and converts it into milliseconds using built-in timeframe helpers.
2. It assigns the timeframe into a bucket label, such as an intraday bucket or a daily-and-above bucket, using fixed thresholds.
3. It resolves a hardcoded fast, slow, and signal length triplet based on:
The selected preset family.
The bucket label.
In some cases, the current minute multiplier for finer mapping.
4. It computes fast and slow EMAs on the selected source and subtracts them to obtain MACD, then computes an EMA of MACD for the signal line.
5. The histogram is derived from the difference between MACD and signal, then passed through a custom smoother.
6. The smoother uses persistent internal state to carry forward its intermediate values from bar to bar. This is intentional and means the smoothing output depends on contiguous bar history.
7. The histogram rising flag compares the current smoothed histogram to its prior value. On the first comparable bar it defaults to “rising” to avoid a missing prior reference.
8. Exports:
A function that returns MACD, signal, smoothed histogram, the resolved lengths, and a text tag.
A function that returns the boolean rising state.
A function that returns a numeric one-or-zero series for direct plotting or downstream numeric logic.
HTF note: this is not a true higher-timeframe request. It does not fetch higher-timeframe candles. It approximates HTF feel by selecting different lengths on the current timeframe.
Parameter Guide
Source — Input price series used for EMA calculations — Default close — Trade-offs/Tips
Preset — Selects the hardcoded mapping family — Default preset A — Preset A is more reactive than preset B in typical use
Table Position — Anchor for an information table — Default top right — Present but not wired in the provided code (Unknown/Optional)
Table Size — Text size for the information table — Default normal — Present but not wired in the provided code (Unknown/Optional)
Dark Mode — Theme toggle for the table — Default enabled — Present but not wired in the provided code (Unknown/Optional)
Show Table — Visibility toggle for the table — Default enabled — Present but not wired in the provided code (Unknown/Optional)
Zero dead-band (epsilon) — Intended neutral band around zero for regime classification — Default zero — Present but not used in the provided code (Unknown/Optional)
Acceptance bars (n) — Intended debounce count for regime confirmation — Default three — Present but not used in the provided code (Unknown/Optional)
Smoothing length — Length controlling the histogram smoother’s responsiveness — Default nine — Smaller values react faster but can reintroduce flip noise
Reading & Interpretation
Smoothed histogram: use it as the momentum core. A positive value implies MACD is above signal, a negative value implies the opposite.
Histogram rising flag:
True means the smoothed histogram increased compared to the prior bar.
False means it did not increase compared to the prior bar.
Demo plot:
The included plot outputs one when rising is true and zero otherwise. It is a diagnostic-style signal line, not a scaled oscillator display.
Practical Workflows & Combinations
Trend following:
Use rising as a momentum confirmation filter after structural direction is established by higher highs and higher lows, or lower highs and lower lows.
Combine with a simple trend filter such as a higher-timeframe moving average from your main script (Unknown/Optional).
Exits and risk management:
If you use rising to stay in trends, consider exiting or reducing exposure when rising turns false for multiple consecutive bars rather than reacting to a single flip.
If you build alerts, evaluate on closed bars to avoid intra-bar flicker in live candles.
Multi-asset and multi-timeframe:
Because the mapping is hardcoded, validate on each asset class you trade. Volatility regimes differ and the perceived “equivalence” across timeframes is not guaranteed.
For consistent behavior, keep the smoothing length aligned across assets and adjust only when flip frequency becomes problematic.
Behavior, Constraints & Performance
Repaint and confirmation:
There is no forward-looking indexing. The logic uses current and prior values only.
Live-bar values can change until the bar closes, so rising can flicker intra-bar if you evaluate it in real time.
security and HTF:
No higher-timeframe candle requests are used. Length mapping is internal and deterministic per chart timeframe.
Resources:
No loops and no arrays in the core calculation path.
The smoother maintains persistent state, which is lightweight but means results depend on uninterrupted history.
Known limits:
Length mappings are fixed. If your chart timeframe is unusual, the bucket choice may not represent what you expect.
Several table and regime-related inputs are declared but not used in the provided code (Unknown/Optional).
The smoother is stateful; resetting chart history or changing symbol can alter early bars until state settles.
Sensible Defaults & Quick Tuning
S tarting point:
Preset A
Smoothing length nine
Source close
Tuning recipes:
Too many flips: increase smoothing length and evaluate rising only on closed bars.
Too sluggish: reduce smoothing length, but expect more short-run reversals.
Different timeframe feel after switching intervals: keep preset fixed and adjust smoothing length first before changing preset.
Want a clean plot signal: use the exported numeric rising series and apply your own display rules in the importing script.
What this indicator is—and isn’t
This is a momentum and regime utility layer built around a MACD-style backbone with hardcoded timeframe-dependent parameters and an optional smoother. It is not a complete trading system, not a risk model, and not predictive. Use it in context with market structure, execution rules, and risk controls.
Disclaimer
The content provided, including all code and materials, is strictly for educational and informational purposes only. It is not intended as, and should not be interpreted as, financial advice, a recommendation to buy or sell any financial instrument, or an offer of any financial product or service. All strategies, tools, and examples discussed are provided for illustrative purposes to demonstrate coding techniques and the functionality of Pine Script within a trading context.
Any results from strategies or tools provided are hypothetical, and past performance is not indicative of future results. Trading and investing involve high risk, including the potential loss of principal, and may not be suitable for all individuals. Before making any trading decisions, please consult with a qualified financial professional to understand the risks involved.
By using this script, you acknowledge and agree that any trading decisions are made solely at your discretion and risk.
Do not use this indicator on Heikin-Ashi, Renko, Kagi, Point-and-Figure, or Range charts, as these chart types can produce unrealistic results for signal markers and alerts.
Best regards and happy trading
Chervolino

ValueAtTime█ OVERVIEW
This library is a Pine Script® programming tool for accessing historical values in a time series using UNIX timestamps . Its data structure and functions index values by time, allowing scripts to retrieve past values based on absolute timestamps or relative time offsets instead of relying on bar index offsets.
█ CONCEPTS
UNIX timestamps
In Pine Script®, a UNIX timestamp is an integer representing the number of milliseconds elapsed since January 1, 1970, at 00:00:00 UTC (the UNIX Epoch ). The timestamp is a unique, absolute representation of a specific point in time. Unlike a calendar date and time, a UNIX timestamp's meaning does not change relative to any time zone .
This library's functions process series values and corresponding UNIX timestamps in pairs , offering a simplified way to identify values that occur at or near distinct points in time instead of on specific bars.
Storing and retrieving time-value pairs
This library's `Data` type defines the structure for collecting time and value information in pairs. Objects of the `Data` type contain the following two fields:
• `times` – An array of "int" UNIX timestamps for each recorded value.
• `values` – An array of "float" values for each saved timestamp.
Each index in both arrays refers to a specific time-value pair. For instance, the `times` and `values` elements at index 0 represent the first saved timestamp and corresponding value. The library functions that maintain `Data` objects queue up to one time-value pair per bar into the object's arrays, where the saved timestamp represents the bar's opening time .
Because the `times` array contains a distinct UNIX timestamp for each item in the `values` array, it serves as a custom mapping for retrieving saved values. All the library functions that return information from a `Data` object use this simple two-step process to identify a value based on time:
1. Perform a binary search on the `times` array to find the earliest saved timestamp closest to the specified time or offset and get the element's index.
2. Access the element from the `values` array at the retrieved index, returning the stored value corresponding to the found timestamp.
Value search methods
There are several techniques programmers can use to identify historical values from corresponding timestamps. This library's functions include three different search methods to locate and retrieve values based on absolute times or relative time offsets:
Timestamp search
Find the value with the earliest saved timestamp closest to a specified timestamp.
Millisecond offset search
Find the value with the earliest saved timestamp closest to a specified number of milliseconds behind the current bar's opening time. This search method provides a time-based alternative to retrieving historical values at specific bar offsets.
Period offset search
Locate the value with the earliest saved timestamp closest to a defined period offset behind the current bar's opening time. The function calculates the span of the offset based on a period string . The "string" must contain one of the following unit tokens:
• "D" for days
• "W" for weeks
• "M" for months
• "Y" for years
• "YTD" for year-to-date, meaning the time elapsed since the beginning of the bar's opening year in the exchange time zone.
The period string can include a multiplier prefix for all supported units except "YTD" (e.g., "2W" for two weeks).
Note that the precise span covered by the "M", "Y", and "YTD" units varies across time. The "1M" period can cover 28, 29, 30, or 31 days, depending on the bar's opening month and year in the exchange time zone. The "1Y" period covers 365 or 366 days, depending on leap years. The "YTD" period's span changes with each new bar, because it always measures the time from the start of the current bar's opening year.
█ CALCULATIONS AND USE
This library's functions offer a flexible, structured approach to retrieving historical values at or near specific timestamps, millisecond offsets, or period offsets for different analytical needs.
See below for explanations of the exported functions and how to use them.
Retrieving single values
The library includes three functions that retrieve a single stored value using timestamp, millisecond offset, or period offset search methods:
• `valueAtTime()` – Locates the saved value with the earliest timestamp closest to a specified timestamp.
• `valueAtTimeOffset()` – Finds the saved value with the earliest timestamp closest to the specified number of milliseconds behind the current bar's opening time.
• `valueAtPeriodOffset()` – Finds the saved value with the earliest timestamp closest to the period-based offset behind the current bar's opening time.
Each function has two overloads for advanced and simple use cases. The first overload searches for a value in a user-specified `Data` object created by the `collectData()` function (see below). It returns a tuple containing the found value and the corresponding timestamp.
The second overload maintains a `Data` object internally to store and retrieve values for a specified `source` series. This overload returns a tuple containing the historical `source` value, the corresponding timestamp, and the current bar's `source` value, making it helpful for comparing past and present values from requested contexts.
Retrieving multiple values
The library includes the following functions to retrieve values from multiple historical points in time, facilitating calculations and comparisons with values retrieved across several intervals:
• `getDataAtTimes()` – Locates a past `source` value for each item in a `timestamps` array. Each retrieved value's timestamp represents the earliest time closest to one of the specified timestamps.
• `getDataAtTimeOffsets()` – Finds a past `source` value for each item in a `timeOffsets` array. Each retrieved value's timestamp represents the earliest time closest to one of the specified millisecond offsets behind the current bar's opening time.
• `getDataAtPeriodOffsets()` – Finds a past value for each item in a `periods` array. Each retrieved value's timestamp represents the earliest time closest to one of the specified period offsets behind the current bar's opening time.
Each function returns a tuple with arrays containing the found `source` values and their corresponding timestamps. In addition, the tuple includes the current `source` value and the symbol's description, which also makes these functions helpful for multi-interval comparisons using data from requested contexts.
Processing period inputs
When writing scripts that retrieve historical values based on several user-specified period offsets, the most concise approach is to create a single text input that allows users to list each period, then process the "string" list into an array for use in the `getDataAtPeriodOffsets()` function.
This library includes a `getArrayFromString()` function to provide a simple way to process strings containing comma-separated lists of periods. The function splits the specified `str` by its commas and returns an array containing every non-empty item in the list with surrounding whitespaces removed. View the example code to see how we use this function to process the value of a text area input .
Calculating period offset times
Because the exact amount of time covered by a specified period offset can vary, it is often helpful to verify the resulting times when using the `valueAtPeriodOffset()` or `getDataAtPeriodOffsets()` functions to ensure the calculations work as intended for your use case.
The library's `periodToTimestamp()` function calculates an offset timestamp from a given period and reference time. With this function, programmers can verify the time offsets in a period-based data search and use the calculated offset times in additional operations.
For periods with "D" or "W" units, the function calculates the time offset based on the absolute number of milliseconds the period covers (e.g., `86400000` for "1D"). For periods with "M", "Y", or "YTD" units, the function calculates an offset time based on the reference time's calendar date in the exchange time zone.
Collecting data
All the `getDataAt*()` functions, and the second overloads of the `valueAt*()` functions, collect and maintain data internally, meaning scripts do not require a separate `Data` object when using them. However, the first overloads of the `valueAt*()` functions do not collect data, because they retrieve values from a user-specified `Data` object.
For cases where a script requires a separate `Data` object for use with these overloads or other custom routines, this library exports the `collectData()` function. This function queues each bar's `source` value and opening timestamp into a `Data` object and returns the object's ID.
This function is particularly useful when searching for values from a specific series more than once. For instance, instead of using multiple calls to the second overloads of `valueAt*()` functions with the same `source` argument, programmers can call `collectData()` to store each bar's `source` and opening timestamp, then use the returned `Data` object's ID in calls to the first `valueAt*()` overloads to reduce memory usage.
The `collectData()` function and all the functions that collect data internally include two optional parameters for limiting the saved time-value pairs to a sliding window: `timeOffsetLimit` and `timeframeLimit`. When either has a non-na argument, the function restricts the collected data to the maximum number of recent bars covered by the specified millisecond- and timeframe-based intervals.
NOTE : All calls to the functions that collect data for a `source` series can execute up to once per bar or realtime tick, because each stored value requires a unique corresponding timestamp. Therefore, scripts cannot call these functions iteratively within a loop . If a call to these functions executes more than once inside a loop's scope, it causes a runtime error.
█ EXAMPLE CODE
The example code at the end of the script demonstrates one possible use case for this library's functions. The code retrieves historical price data at user-specified period offsets, calculates price returns for each period from the retrieved data, and then populates a table with the results.
The example code's process is as follows:
1. Input a list of periods – The user specifies a comma-separated list of period strings in the script's "Period list" input (e.g., "1W, 1M, 3M, 1Y, YTD"). Each item in the input list represents a period offset from the latest bar's opening time.
2. Process the period list – The example calls `getArrayFromString()` on the first bar to split the input list by its commas and construct an array of period strings.
3. Request historical data – The code uses a call to `getDataAtPeriodOffsets()` as the `expression` argument in a request.security() call to retrieve the closing prices of "1D" bars for each period included in the processed `periods` array.
4. Display information in a table – On the latest bar, the code uses the retrieved data to calculate price returns over each specified period, then populates a two-row table with the results. The cells for each return percentage are color-coded based on the magnitude and direction of the price change. The cells also include tooltips showing the compared daily bar's opening date in the exchange time zone.
█ NOTES
• This library's architecture relies on a user-defined type (UDT) for its data storage format. UDTs are blueprints from which scripts create objects , i.e., composite structures with fields containing independent values or references of any supported type.
• The library functions search through a `Data` object's `times` array using the array.binary_search_leftmost() function, which is more efficient than looping through collected data to identify matching timestamps. Note that this built-in works only for arrays with elements sorted in ascending order .
• Each function that collects data from a `source` series updates the values and times stored in a local `Data` object's arrays. If a single call to these functions were to execute in a loop , it would store multiple values with an identical timestamp, which can cause erroneous search behavior. To prevent looped calls to these functions, the library uses the `checkCall()` helper function in their scopes. This function maintains a counter that increases by one each time it executes on a confirmed bar. If the count exceeds the total number of bars, indicating the call executes more than once in a loop, it raises a runtime error .
• Typically, when requesting higher-timeframe data with request.security() while using barmerge.lookahead_on as the `lookahead` argument, the `expression` argument should be offset with the history-referencing operator to prevent lookahead bias on historical bars. However, the call in this script's example code enables lookahead without offsetting the `expression` because the script displays results only on the last historical bar and all realtime bars, where there is no future data to leak into the past. This call ensures the displayed results use the latest data available from the context on realtime bars.
Look first. Then leap.
█ EXPORTED TYPES
Data
A structure for storing successive timestamps and corresponding values from a dataset.
Fields:
times (array) : An "int" array containing a UNIX timestamp for each value in the `values` array.
values (array) : A "float" array containing values corresponding to the timestamps in the `times` array.
█ EXPORTED FUNCTIONS
getArrayFromString(str)
Splits a "string" into an array of substrings using the comma (`,`) as the delimiter. The function trims surrounding whitespace characters from each substring, and it excludes empty substrings from the result.
Parameters:
str (series string) : The "string" to split into an array based on its commas.
Returns: (array) An array of trimmed substrings from the specified `str`.
periodToTimestamp(period, referenceTime)
Calculates a UNIX timestamp representing the point offset behind a reference time by the amount of time within the specified `period`.
Parameters:
period (series string) : The period string, which determines the time offset of the returned timestamp. The specified argument must contain a unit and an optional multiplier (e.g., "1Y", "3M", "2W", "YTD"). Supported units are:
- "Y" for years.
- "M" for months.
- "W" for weeks.
- "D" for days.
- "YTD" (Year-to-date) for the span from the start of the `referenceTime` value's year in the exchange time zone. An argument with this unit cannot contain a multiplier.
referenceTime (series int) : The millisecond UNIX timestamp from which to calculate the offset time.
Returns: (int) A millisecond UNIX timestamp representing the offset time point behind the `referenceTime`.
collectData(source, timeOffsetLimit, timeframeLimit)
Collects `source` and `time` data successively across bars. The function stores the information within a `Data` object for use in other exported functions/methods, such as `valueAtTimeOffset()` and `valueAtPeriodOffset()`. Any call to this function cannot execute more than once per bar or realtime tick.
Parameters:
source (series float) : The source series to collect. The function stores each value in the series with an associated timestamp representing its corresponding bar's opening time.
timeOffsetLimit (simple int) : Optional. A time offset (range) in milliseconds. If specified, the function limits the collected data to the maximum number of bars covered by the range, with a minimum of one bar. If the call includes a non-empty `timeframeLimit` value, the function limits the data using the largest number of bars covered by the two ranges. The default is `na`.
timeframeLimit (simple string) : Optional. A valid timeframe string. If specified and not empty, the function limits the collected data to the maximum number of bars covered by the timeframe, with a minimum of one bar. If the call includes a non-na `timeOffsetLimit` value, the function limits the data using the largest number of bars covered by the two ranges. The default is `na`.
Returns: (Data) A `Data` object containing collected `source` values and corresponding timestamps over the allowed time range.
method valueAtTime(data, timestamp)
(Overload 1 of 2) Retrieves value and time data from a `Data` object's fields at the index of the earliest timestamp closest to the specified `timestamp`. Callable as a method or a function.
Parameters:
data (series Data) : The `Data` object containing the collected time and value data.
timestamp (series int) : The millisecond UNIX timestamp to search. The function returns data for the earliest saved timestamp that is closest to the value.
Returns: ( ) A tuple containing the following data from the `Data` object:
- The stored value corresponding to the identified timestamp ("float").
- The earliest saved timestamp that is closest to the specified `timestamp` ("int").
valueAtTime(source, timestamp, timeOffsetLimit, timeframeLimit)
(Overload 2 of 2) Retrieves `source` and time information for the earliest bar whose opening timestamp is closest to the specified `timestamp`. Any call to this function cannot execute more than once per bar or realtime tick.
Parameters:
source (series float) : The source series to analyze. The function stores each value in the series with an associated timestamp representing its corresponding bar's opening time.
timestamp (series int) : The millisecond UNIX timestamp to search. The function returns data for the earliest bar whose timestamp is closest to the value.
timeOffsetLimit (simple int) : Optional. A time offset (range) in milliseconds. If specified, the function limits the collected data to the maximum number of bars covered by the range, with a minimum of one bar. If the call includes a non-empty `timeframeLimit` value, the function limits the data using the largest number of bars covered by the two ranges. The default is `na`.
timeframeLimit (simple string) : (simple string) Optional. A valid timeframe string. If specified and not empty, the function limits the collected data to the maximum number of bars covered by the timeframe, with a minimum of one bar. If the call includes a non-na `timeOffsetLimit` value, the function limits the data using the largest number of bars covered by the two ranges. The default is `na`.
Returns: ( ) A tuple containing the following data:
- The `source` value corresponding to the identified timestamp ("float").
- The earliest bar's timestamp that is closest to the specified `timestamp` ("int").
- The current bar's `source` value ("float").
method valueAtTimeOffset(data, timeOffset)
(Overload 1 of 2) Retrieves value and time data from a `Data` object's fields at the index of the earliest saved timestamp closest to `timeOffset` milliseconds behind the current bar's opening time. Callable as a method or a function.
Parameters:
data (series Data) : The `Data` object containing the collected time and value data.
timeOffset (series int) : The millisecond offset behind the bar's opening time. The function returns data for the earliest saved timestamp that is closest to the calculated offset time.
Returns: ( ) A tuple containing the following data from the `Data` object:
- The stored value corresponding to the identified timestamp ("float").
- The earliest saved timestamp that is closest to `timeOffset` milliseconds before the current bar's opening time ("int").
valueAtTimeOffset(source, timeOffset, timeOffsetLimit, timeframeLimit)
(Overload 2 of 2) Retrieves `source` and time information for the earliest bar whose opening timestamp is closest to `timeOffset` milliseconds behind the current bar's opening time. Any call to this function cannot execute more than once per bar or realtime tick.
Parameters:
source (series float) : The source series to analyze. The function stores each value in the series with an associated timestamp representing its corresponding bar's opening time.
timeOffset (series int) : The millisecond offset behind the bar's opening time. The function returns data for the earliest bar's timestamp that is closest to the calculated offset time.
timeOffsetLimit (simple int) : Optional. A time offset (range) in milliseconds. If specified, the function limits the collected data to the maximum number of bars covered by the range, with a minimum of one bar. If the call includes a non-empty `timeframeLimit` value, the function limits the data using the largest number of bars covered by the two ranges. The default is `na`.
timeframeLimit (simple string) : Optional. A valid timeframe string. If specified and not empty, the function limits the collected data to the maximum number of bars covered by the timeframe, with a minimum of one bar. If the call includes a non-na `timeOffsetLimit` value, the function limits the data using the largest number of bars covered by the two ranges. The default is `na`.
Returns: ( ) A tuple containing the following data:
- The `source` value corresponding to the identified timestamp ("float").
- The earliest bar's timestamp that is closest to `timeOffset` milliseconds before the current bar's opening time ("int").
- The current bar's `source` value ("float").
method valueAtPeriodOffset(data, period)
(Overload 1 of 2) Retrieves value and time data from a `Data` object's fields at the index of the earliest timestamp closest to a calculated offset behind the current bar's opening time. The calculated offset represents the amount of time covered by the specified `period`. Callable as a method or a function.
Parameters:
data (series Data) : The `Data` object containing the collected time and value data.
period (series string) : The period string, which determines the calculated time offset. The specified argument must contain a unit and an optional multiplier (e.g., "1Y", "3M", "2W", "YTD"). Supported units are:
- "Y" for years.
- "M" for months.
- "W" for weeks.
- "D" for days.
- "YTD" (Year-to-date) for the span from the start of the current bar's year in the exchange time zone. An argument with this unit cannot contain a multiplier.
Returns: ( ) A tuple containing the following data from the `Data` object:
- The stored value corresponding to the identified timestamp ("float").
- The earliest saved timestamp that is closest to the calculated offset behind the bar's opening time ("int").
valueAtPeriodOffset(source, period, timeOffsetLimit, timeframeLimit)
(Overload 2 of 2) Retrieves `source` and time information for the earliest bar whose opening timestamp is closest to a calculated offset behind the current bar's opening time. The calculated offset represents the amount of time covered by the specified `period`. Any call to this function cannot execute more than once per bar or realtime tick.
Parameters:
source (series float) : The source series to analyze. The function stores each value in the series with an associated timestamp representing its corresponding bar's opening time.
period (series string) : The period string, which determines the calculated time offset. The specified argument must contain a unit and an optional multiplier (e.g., "1Y", "3M", "2W", "YTD"). Supported units are:
- "Y" for years.
- "M" for months.
- "W" for weeks.
- "D" for days.
- "YTD" (Year-to-date) for the span from the start of the current bar's year in the exchange time zone. An argument with this unit cannot contain a multiplier.
timeOffsetLimit (simple int) : Optional. A time offset (range) in milliseconds. If specified, the function limits the collected data to the maximum number of bars covered by the range, with a minimum of one bar. If the call includes a non-empty `timeframeLimit` value, the function limits the data using the largest number of bars covered by the two ranges. The default is `na`.
timeframeLimit (simple string) : Optional. A valid timeframe string. If specified and not empty, the function limits the collected data to the maximum number of bars covered by the timeframe, with a minimum of one bar. If the call includes a non-na `timeOffsetLimit` value, the function limits the data using the largest number of bars covered by the two ranges. The default is `na`.
Returns: ( ) A tuple containing the following data:
- The `source` value corresponding to the identified timestamp ("float").
- The earliest bar's timestamp that is closest to the calculated offset behind the current bar's opening time ("int").
- The current bar's `source` value ("float").
getDataAtTimes(timestamps, source, timeOffsetLimit, timeframeLimit)
Retrieves `source` and time information for each bar whose opening timestamp is the earliest one closest to one of the UNIX timestamps specified in the `timestamps` array. Any call to this function cannot execute more than once per bar or realtime tick.
Parameters:
timestamps (array) : An array of "int" values representing UNIX timestamps. The function retrieves `source` and time data for each element in this array.
source (series float) : The source series to analyze. The function stores each value in the series with an associated timestamp representing its corresponding bar's opening time.
timeOffsetLimit (simple int) : Optional. A time offset (range) in milliseconds. If specified, the function limits the collected data to the maximum number of bars covered by the range, with a minimum of one bar. If the call includes a non-empty `timeframeLimit` value, the function limits the data using the largest number of bars covered by the two ranges. The default is `na`.
timeframeLimit (simple string) : Optional. A valid timeframe string. If specified and not empty, the function limits the collected data to the maximum number of bars covered by the timeframe, with a minimum of one bar. If the call includes a non-na `timeOffsetLimit` value, the function limits the data using the largest number of bars covered by the two ranges. The default is `na`.
Returns: ( ) A tuple of the following data:
- An array containing a `source` value for each identified timestamp (array).
- An array containing an identified timestamp for each item in the `timestamps` array (array).
- The current bar's `source` value ("float").
- The symbol's description from `syminfo.description` ("string").
getDataAtTimeOffsets(timeOffsets, source, timeOffsetLimit, timeframeLimit)
Retrieves `source` and time information for each bar whose opening timestamp is the earliest one closest to one of the time offsets specified in the `timeOffsets` array. Each offset in the array represents the absolute number of milliseconds behind the current bar's opening time. Any call to this function cannot execute more than once per bar or realtime tick.
Parameters:
timeOffsets (array) : An array of "int" values representing the millisecond time offsets used in the search. The function retrieves `source` and time data for each element in this array. For example, the array ` ` specifies that the function returns data for the timestamps closest to one day and one week behind the current bar's opening time.
source (float) : (series float) The source series to analyze. The function stores each value in the series with an associated timestamp representing its corresponding bar's opening time.
timeOffsetLimit (simple int) : Optional. A time offset (range) in milliseconds. If specified, the function limits the collected data to the maximum number of bars covered by the range, with a minimum of one bar. If the call includes a non-empty `timeframeLimit` value, the function limits the data using the largest number of bars covered by the two ranges. The default is `na`.
timeframeLimit (simple string) : Optional. A valid timeframe string. If specified and not empty, the function limits the collected data to the maximum number of bars covered by the timeframe, with a minimum of one bar. If the call includes a non-na `timeOffsetLimit` value, the function limits the data using the largest number of bars covered by the two ranges. The default is `na`.
Returns: ( ) A tuple of the following data:
- An array containing a `source` value for each identified timestamp (array).
- An array containing an identified timestamp for each offset specified in the `timeOffsets` array (array).
- The current bar's `source` value ("float").
- The symbol's description from `syminfo.description` ("string").
getDataAtPeriodOffsets(periods, source, timeOffsetLimit, timeframeLimit)
Retrieves `source` and time information for each bar whose opening timestamp is the earliest one closest to a calculated offset behind the current bar's opening time. Each calculated offset represents the amount of time covered by a period specified in the `periods` array. Any call to this function cannot execute more than once per bar or realtime tick.
Parameters:
periods (array) : An array of period strings, which determines the time offsets used in the search. The function retrieves `source` and time data for each element in this array. For example, the array ` ` specifies that the function returns data for the timestamps closest to one day, week, and month behind the current bar's opening time. Each "string" in the array must contain a unit and an optional multiplier. Supported units are:
- "Y" for years.
- "M" for months.
- "W" for weeks.
- "D" for days.
- "YTD" (Year-to-date) for the span from the start of the current bar's year in the exchange time zone. An argument with this unit cannot contain a multiplier.
source (float) : (series float) The source series to analyze. The function stores each value in the series with an associated timestamp representing its corresponding bar's opening time.
timeOffsetLimit (simple int) : Optional. A time offset (range) in milliseconds. If specified, the function limits the collected data to the maximum number of bars covered by the range, with a minimum of one bar. If the call includes a non-empty `timeframeLimit` value, the function limits the data using the largest number of bars covered by the two ranges. The default is `na`.
timeframeLimit (simple string) : Optional. A valid timeframe string. If specified and not empty, the function limits the collected data to the maximum number of bars covered by the timeframe, with a minimum of one bar. If the call includes a non-na `timeOffsetLimit` value, the function limits the data using the largest number of bars covered by the two ranges. The default is `na`.
Returns: ( ) A tuple of the following data:
- An array containing a `source` value for each identified timestamp (array).
- An array containing an identified timestamp for each period specified in the `periods` array (array).
- The current bar's `source` value ("float").
- The symbol's description from `syminfo.description` ("string").

Geo. Geo.
This library provides a comprehensive set of geometric functions based on 2 simple types for point and line manipulation, point array calculations, some vector operations (Borrowed from @ricardosantos ), angle calculations, and basic polygon analysis. It offers tools for creating, transforming, and analyzing geometric shapes and their relationships.
View the source code for detailed documentation on each function and type.
═════════════════════════════════════════════════════════════════════════
█ OVERVIEW
This library enhances TradingView's Pine Script with robust geometric capabilities. It introduces the Point and Line types, along with a suite of functions for various geometric operations. These functionalities empower you to perform advanced calculations, manipulations, and analyses involving points, lines, vectors, angles, and polygons directly within your Pine scripts. The example is at the bottom of the script. ( Commented out )
█ CONCEPTS
This library revolves around two fundamental types:
• Point: Represents a point in 2D space with x and y coordinates, along with optional 'a' (angle) and 'v' (value) fields for versatile use. Crucially, for plotting, utilize the `.to_chart_point()` method to convert Points into plottable chart.point objects.
• Line: Defined by a starting Point and a slope , enabling calculations like getting y for a given x, or finding intersection points.
█ FEATURES
• Point Manipulation: Perform operations like addition, subtraction, scaling, rotation, normalization, calculating distances, dot products, cross products, midpoints, and more with Point objects.
• Line Operations: Create lines, determine their slope, calculate y from x (and vice versa), and find the intersection points of two lines.
• Vector Operations: Perform vector addition, subtraction, multiplication, division, negation, perpendicular vector calculation, floor, fractional part, sine, absolute value, modulus, sign, round, scaling, rescaling, rotation, and ceiling operations.
• Angle Calculations: Compute angles between points in degrees or radians, including signed, unsigned, and 360-degree angles.
• Polygon Analysis: Calculate the area, perimeter, and centroid of polygons. Check if a point is inside a given polygon and determine the convex hull perimeter.
• Chart Plotting: Conveniently convert Point objects to chart.point objects for plotting lines and points on the chart. The library also includes functions for plotting lines between individual and series of points.
• Utility Functions: Includes helper functions such as square root, square, cosine, sine, tangent, arc cosine, arc sine, arc tangent, atan2, absolute distance, golden ratio tolerance check, fractional part, and safe index/check for chart plotting boundaries.
█ HOW TO USE
1 — Include the library in your script using:
import kaigouthro/geo/1
2 — Create Point and Line objects:
p1 = geo.Point(bar_index, close)
p2 = geo.Point(bar_index , open)
myLine = geo.Line(p1, geo.slope(p1, p2))
// maybe use that line to detect a crossing for an alert ... hmmm
3 — Utilize the provided functions:
distance = geo.distance(p1, p2)
intersection = geo.intersection(line1, line2)
4 — For plotting labels, lines, convert Point to chart.point :
label.new(p1.to_chart_point(), " Hi ")
line.new(p1.to_chart_point(),p2.to_chart_point())
█ NOTES
This description provides a concise overview. Consult the library's source code for in-depth documentation, including detailed descriptions, parameter types, and return values for each function and method. The source code is structured with comprehensive comments using the `//@` format for seamless integration with TradingView's auto-documentation features.
█ Possibilities..
Library "geo"
This library provides a comprehensive set of geometric functions and types, including point and line manipulation, vector operations, angle calculations, and polygon analysis. It offers tools for creating, transforming, and analyzing geometric shapes and their relationships.
sqrt(value)
Square root function
Parameters:
value (float) : (float) - The number to take the square root of
Returns: (float) - The square root of the input value
sqr(x)
Square function
Parameters:
x (float) : (float) - The number to square
Returns: (float) - The square of the input value
cos(v)
Cosine function
Parameters:
v (float) : (series float) - The value to find the cosine of
Returns: (series float) - The cosine of the input value
sin(v)
Sine function
Parameters:
v (float) : (series float) - The value to find the sine of
Returns: (series float) - The sine of the input value
tan(v)
Tangent function
Parameters:
v (float) : (series float) - The value to find the tangent of
Returns: (series float) - The tangent of the input value
acos(v)
Arc cosine function
Parameters:
v (float) : (series float) - The value to find the arc cosine of
Returns: (series float) - The arc cosine of the input value
asin(v)
Arc sine function
Parameters:
v (float) : (series float) - The value to find the arc sine of
Returns: (series float) - The arc sine of the input value
atan(v)
Arc tangent function
Parameters:
v (float) : (series float) - The value to find the arc tangent of
Returns: (series float) - The arc tangent of the input value
atan2(dy, dx)
atan2 function
Parameters:
dy (float) : (float) - The y-coordinate
dx (float) : (float) - The x-coordinate
Returns: (float) - The angle in radians
gap(_value1, __value2)
Absolute distance between any two float values
Parameters:
_value1 (float) : First value
__value2 (float)
Returns: Absolute Positive Distance
phi_tol(a, b, tolerance)
Check if the ratio is within the tolerance of the golden ratio
Parameters:
a (float) : (float) The first number
b (float) : (float) The second number
tolerance (float) : (float) The tolerance percennt as 1 = 1 percent
Returns: (bool) True if the ratio is within the tolerance, false otherwise
frac(x)
frad Fractional
Parameters:
x (float) : (float) - The number to convert to fractional
Returns: (float) - The number converted to fractional
safeindex(x, limit)
limiting int to hold the value within the chart range
Parameters:
x (float) : (float) - The number to limit
limit (int)
Returns: (int) - The number limited to the chart range
safecheck(x, limit)
limiting int check if within the chartplottable range
Parameters:
x (float) : (float) - The number to limit
limit (int)
Returns: (int) - The number limited to the chart range
interpolate(a, b, t)
interpolate between two values
Parameters:
a (float) : (float) - The first value
b (float) : (float) - The second value
t (float) : (float) - The interpolation factor (0 to 1)
Returns: (float) - The interpolated value
gcd(_numerator, _denominator)
Greatest common divisor of two integers
Parameters:
_numerator (int)
_denominator (int)
Returns: (int) The greatest common divisor
method set_x(self, value)
Set the x value of the point, and pass point for chaining
Namespace types: Point
Parameters:
self (Point) : (Point) The point to modify
value (float) : (float) The new x-coordinate
method set_y(self, value)
Set the y value of the point, and pass point for chaining
Namespace types: Point
Parameters:
self (Point) : (Point) The point to modify
value (float) : (float) The new y-coordinate
method get_x(self)
Get the x value of the point
Namespace types: Point
Parameters:
self (Point) : (Point) The point to get the x-coordinate from
Returns: (float) The x-coordinate
method get_y(self)
Get the y value of the point
Namespace types: Point
Parameters:
self (Point) : (Point) The point to get the y-coordinate from
Returns: (float) The y-coordinate
method vmin(self)
Lowest element of the point
Namespace types: Point
Parameters:
self (Point) : (Point) The point
Returns: (float) The lowest value between x and y
method vmax(self)
Highest element of the point
Namespace types: Point
Parameters:
self (Point) : (Point) The point
Returns: (float) The highest value between x and y
method add(p1, p2)
Addition
Namespace types: Point
Parameters:
p1 (Point) : (Point) - The first point
p2 (Point) : (Point) - The second point
Returns: (Point) - the add of the two points
method sub(p1, p2)
Subtraction
Namespace types: Point
Parameters:
p1 (Point) : (Point) - The first point
p2 (Point) : (Point) - The second point
Returns: (Point) - the sub of the two points
method mul(p, scalar)
Multiplication by scalar
Namespace types: Point
Parameters:
p (Point) : (Point) - The point
scalar (float) : (float) - The scalar to multiply by
Returns: (Point) - the multiplied point of the point and the scalar
method div(p, scalar)
Division by scalar
Namespace types: Point
Parameters:
p (Point) : (Point) - The point
scalar (float) : (float) - The scalar to divide by
Returns: (Point) - the divided point of the point and the scalar
method rotate(p, angle)
Rotate a point around the origin by an angle (in degrees)
Namespace types: Point
Parameters:
p (Point) : (Point) - The point to rotate
angle (float) : (float) - The angle to rotate by in degrees
Returns: (Point) - the rotated point
method length(p)
Length of the vector from origin to the point
Namespace types: Point
Parameters:
p (Point) : (Point) - The point
Returns: (float) - the length of the point
method length_squared(p)
Length squared of the vector
Namespace types: Point
Parameters:
p (Point) : (Point) The point
Returns: (float) The squared length of the point
method normalize(p)
Normalize the point to a unit vector
Namespace types: Point
Parameters:
p (Point) : (Point) - The point to normalize
Returns: (Point) - the normalized point
method dot(p1, p2)
Dot product
Namespace types: Point
Parameters:
p1 (Point) : (Point) - The first point
p2 (Point) : (Point) - The second point
Returns: (float) - the dot of the two points
method cross(p1, p2)
Cross product result (in 2D, this is a scalar)
Namespace types: Point
Parameters:
p1 (Point) : (Point) - The first point
p2 (Point) : (Point) - The second point
Returns: (float) - the cross of the two points
method distance(p1, p2)
Distance between two points
Namespace types: Point
Parameters:
p1 (Point) : (Point) - The first point
p2 (Point) : (Point) - The second point
Returns: (float) - the distance of the two points
method Point(x, y, a, v)
Point Create Convenience
Namespace types: series float, simple float, input float, const float
Parameters:
x (float)
y (float)
a (float)
v (float)
Returns: (Point) new point
method angle(p1, p2)
Angle between two points in degrees
Namespace types: Point
Parameters:
p1 (Point) : (Point) - The first point
p2 (Point) : (Point) - The second point
Returns: (float) - the angle of the first point and the second point
method angle_between(p, pivot, other)
Angle between two points in degrees from a pivot point
Namespace types: Point
Parameters:
p (Point) : (Point) - The point to calculate the angle from
pivot (Point) : (Point) - The pivot point
other (Point) : (Point) - The other point
Returns: (float) - the angle between the two points
method translate(p, from_origin, to_origin)
Translate a point from one origin to another
Namespace types: Point
Parameters:
p (Point) : (Point) - The point to translate
from_origin (Point) : (Point) - The origin to translate from
to_origin (Point) : (Point) - The origin to translate to
Returns: (Point) - the translated point
method midpoint(p1, p2)
Midpoint of two points
Namespace types: Point
Parameters:
p1 (Point) : (Point) - The first point
p2 (Point) : (Point) - The second point
Returns: (Point) - The midpoint of the two points
method rotate_around(p, angle, pivot)
Rotate a point around a pivot point by an angle (in degrees)
Namespace types: Point
Parameters:
p (Point) : (Point) - The point to rotate
angle (float) : (float) - The angle to rotate by in degrees
pivot (Point) : (Point) - The pivot point to rotate around
Returns: (Point) - the rotated point
method multiply(_a, _b)
Multiply vector _a with _b
Namespace types: Point
Parameters:
_a (Point) : (Point) The first point
_b (Point) : (Point) The second point
Returns: (Point) The result of the multiplication
method divide(_a, _b)
Divide vector _a by _b
Namespace types: Point
Parameters:
_a (Point) : (Point) The first point
_b (Point) : (Point) The second point
Returns: (Point) The result of the division
method negate(_a)
Negative of vector _a
Namespace types: Point
Parameters:
_a (Point) : (Point) The point to negate
Returns: (Point) The negated point
method perp(_a)
Perpendicular Vector of _a
Namespace types: Point
Parameters:
_a (Point) : (Point) The point
Returns: (Point) The perpendicular point
method vfloor(_a)
Compute the floor of argument vector _a
Namespace types: Point
Parameters:
_a (Point) : (Point) The point
Returns: (Point) The floor of the point
method fractional(_a)
Compute the fractional part of the elements from vector _a
Namespace types: Point
Parameters:
_a (Point) : (Point) The point
Returns: (Point) The fractional part of the point
method vsin(_a)
Compute the sine of argument vector _a
Namespace types: Point
Parameters:
_a (Point) : (Point) The point
Returns: (Point) The sine of the point
lcm(a, b)
Least common multiple of two integers
Parameters:
a (int) : (int) The first integer
b (int) : (int) The second integer
Returns: (int) The least common multiple
method vabs(_a)
Compute the absolute of argument vector _a
Namespace types: Point
Parameters:
_a (Point) : (Point) The point
Returns: (Point) The absolute of the point
method vmod(_a, _b)
Compute the mod of argument vector _a
Namespace types: Point
Parameters:
_a (Point) : (Point) The point
_b (float) : (float) The mod
Returns: (Point) The mod of the point
method vsign(_a)
Compute the sign of argument vector _a
Namespace types: Point
Parameters:
_a (Point) : (Point) The point
Returns: (Point) The sign of the point
method vround(_a)
Compute the round of argument vector _a
Namespace types: Point
Parameters:
_a (Point) : (Point) The point
Returns: (Point) The round of the point
method normalize_y(p, height)
normalizes the y value of a point to an input height
Namespace types: Point
Parameters:
p (Point) : (Point) - The point to normalize
height (float) : (float) - The height to normalize to
Returns: (Point) - the normalized point
centroid(points)
Calculate the centroid of multiple points
Parameters:
points (array) : (array) The array of points
Returns: (Point) The centroid point
random_point(_height, _width, _origin, _centered)
Random Point in a given height and width
Parameters:
_height (float) : (float) The height of the area to generate the point in
_width (float) : (float) The width of the area to generate the point in
_origin (Point) : (Point) The origin of the area to generate the point in (default: na, will create a Point(0, 0))
_centered (bool) : (bool) Center the origin point in the area, otherwise, positive h/w (default: false)
Returns: (Point) The random point in the given area
random_point_array(_origin, _height, _width, _centered, _count)
Random Point Array in a given height and width
Parameters:
_origin (Point) : (Point) The origin of the area to generate the array (default: na, will create a Point(0, 0))
_height (float) : (float) The height of the area to generate the array
_width (float) : (float) The width of the area to generate the array
_centered (bool) : (bool) Center the origin point in the area, otherwise, positive h/w (default: false)
_count (int) : (int) The number of points to generate (default: 50)
Returns: (array) The random point array in the given area
method sort_points(points, by_x)
Sorts an array of points by x or y coordinate
Namespace types: array
Parameters:
points (array) : (array) The array of points to sort
by_x (bool) : (bool) Whether to sort by x-coordinate (true) or y-coordinate (false)
Returns: (array) The sorted array of points
method equals(_a, _b)
Compares two points for equality
Namespace types: Point
Parameters:
_a (Point) : (Point) The first point
_b (Point) : (Point) The second point
Returns: (bool) True if the points are equal, false otherwise
method max(origin, _a, _b)
Maximum of two points from origin, using dot product
Namespace types: Point
Parameters:
origin (Point)
_a (Point) : (Point) The first point
_b (Point) : (Point) The second point
Returns: (Point) The maximum point
method min(origin, _a, _b)
Minimum of two points from origin, using dot product
Namespace types: Point
Parameters:
origin (Point)
_a (Point) : (Point) The first point
_b (Point) : (Point) The second point
Returns: (Point) The minimum point
method avg_x(points)
Average x of point array
Namespace types: array
Parameters:
points (array) : (array) The array of points
Returns: (float) The average x-coordinate
method avg_y(points)
Average y of point array
Namespace types: array
Parameters:
points (array) : (array) The array of points
Returns: (float) The average y-coordinate
method range_x(points)
Range of x values in point array
Namespace types: array
Parameters:
points (array) : (array) The array of points
Returns: (float) The range of x-coordinates
method range_y(points)
Range of y values in point array
Namespace types: array
Parameters:
points (array) : (array) The array of points
Returns: (float) The range of y-coordinates
method max_x(points)
max of x values in point array
Namespace types: array
Parameters:
points (array) : (array) The array of points
Returns: (float) The max of x-coordinates
method min_y(points)
min of x values in point array
Namespace types: array
Parameters:
points (array) : (array) The array of points
Returns: (float) The min of x-coordinates
method scale(_a, _scalar)
Scale a point by a scalar
Namespace types: Point
Parameters:
_a (Point) : (Point) The point to scale
_scalar (float) : (float) The scalar value
Returns: (Point) The scaled point
method rescale(_a, _length)
Rescale a point to a new magnitude
Namespace types: Point
Parameters:
_a (Point) : (Point) The point to rescale
_length (float) : (float) The new magnitude
Returns: (Point) The rescaled point
method rotate_rad(_a, _radians)
Rotate a point by an angle in radians
Namespace types: Point
Parameters:
_a (Point) : (Point) The point to rotate
_radians (float) : (float) The angle in radians
Returns: (Point) The rotated point
method rotate_degree(_a, _degree)
Rotate a point by an angle in degrees
Namespace types: Point
Parameters:
_a (Point) : (Point) The point to rotate
_degree (float) : (float) The angle in degrees
Returns: (Point) The rotated point
method vceil(_a, _digits)
Ceil a point to a certain number of digits
Namespace types: Point
Parameters:
_a (Point) : (Point) The point to ceil
_digits (int) : (int) The number of digits to ceil to
Returns: (Point) The ceiled point
method vpow(_a, _exponent)
Raise both point elements to a power
Namespace types: Point
Parameters:
_a (Point) : (Point) The point
_exponent (float) : (float) The exponent
Returns: (Point) The point with elements raised to the power
method perpendicular_distance(_a, _b, _c)
Distance from point _a to line between _b and _c
Namespace types: Point
Parameters:
_a (Point) : (Point) The point
_b (Point) : (Point) The start point of the line
_c (Point) : (Point) The end point of the line
Returns: (float) The perpendicular distance
method project(_a, _axis)
Project a point onto another
Namespace types: Point
Parameters:
_a (Point) : (Point) The point to project
_axis (Point) : (Point) The point to project onto
Returns: (Point) The projected point
method projectN(_a, _axis)
Project a point onto a point of unit length
Namespace types: Point
Parameters:
_a (Point) : (Point) The point to project
_axis (Point) : (Point) The unit length point to project onto
Returns: (Point) The projected point
method reflect(_a, _axis)
Reflect a point on another
Namespace types: Point
Parameters:
_a (Point) : (Point) The point to reflect
_axis (Point) : (Point) The point to reflect on
Returns: (Point) The reflected point
method reflectN(_a, _axis)
Reflect a point to an arbitrary axis
Namespace types: Point
Parameters:
_a (Point) : (Point) The point to reflect
_axis (Point) : (Point) The axis to reflect to
Returns: (Point) The reflected point
method angle_rad(_a)
Angle in radians of a point
Namespace types: Point
Parameters:
_a (Point) : (Point) The point
Returns: (float) The angle in radians
method angle_unsigned(_a, _b)
Unsigned degree angle between 0 and +180 by given two points
Namespace types: Point
Parameters:
_a (Point) : (Point) The first point
_b (Point) : (Point) The second point
Returns: (float) The unsigned angle in degrees
method angle_signed(_a, _b)
Signed degree angle between -180 and +180 by given two points
Namespace types: Point
Parameters:
_a (Point) : (Point) The first point
_b (Point) : (Point) The second point
Returns: (float) The signed angle in degrees
method angle_360(_a, _b)
Degree angle between 0 and 360 by given two points
Namespace types: Point
Parameters:
_a (Point) : (Point) The first point
_b (Point) : (Point) The second point
Returns: (float) The angle in degrees (0-360)
method clamp(_a, _vmin, _vmax)
Restricts a point between a min and max value
Namespace types: Point
Parameters:
_a (Point) : (Point) The point to restrict
_vmin (Point) : (Point) The minimum point
_vmax (Point) : (Point) The maximum point
Returns: (Point) The restricted point
method lerp(_a, _b, _rate_of_move)
Linearly interpolates between points a and b by _rate_of_move
Namespace types: Point
Parameters:
_a (Point) : (Point) The starting point
_b (Point) : (Point) The ending point
_rate_of_move (float) : (float) The rate of movement (0-1)
Returns: (Point) The interpolated point
method slope(p1, p2)
Slope of a line between two points
Namespace types: Point
Parameters:
p1 (Point) : (Point) - The first point
p2 (Point) : (Point) - The second point
Returns: (float) - The slope of the line
method gety(self, x)
Get y-coordinate of a point on the line given its x-coordinate
Namespace types: Line
Parameters:
self (Line) : (Line) - The line
x (float) : (float) - The x-coordinate
Returns: (float) - The y-coordinate
method getx(self, y)
Get x-coordinate of a point on the line given its y-coordinate
Namespace types: Line
Parameters:
self (Line) : (Line) - The line
y (float) : (float) - The y-coordinate
Returns: (float) - The x-coordinate
method intersection(self, other)
Intersection point of two lines
Namespace types: Line
Parameters:
self (Line) : (Line) - The first line
other (Line) : (Line) - The second line
Returns: (Point) - The intersection point
method calculate_arc_point(self, b, p3)
Calculate a point on the arc defined by three points
Namespace types: Point
Parameters:
self (Point) : (Point) The starting point of the arc
b (Point) : (Point) The middle point of the arc
p3 (Point) : (Point) The end point of the arc
Returns: (Point) A point on the arc
approximate_center(point1, point2, point3)
Approximate the center of a spiral using three points
Parameters:
point1 (Point) : (Point) The first point
point2 (Point) : (Point) The second point
point3 (Point) : (Point) The third point
Returns: (Point) The approximate center point
createEdge(center, radius, angle)
Get coordinate from center by radius and angle
Parameters:
center (Point) : (Point) - The center point
radius (float) : (float) - The radius of the circle
angle (float) : (float) - The angle in degrees
Returns: (Point) - The coordinate on the circle
getGrowthFactor(p1, p2, p3)
Get growth factor of spiral point
Parameters:
p1 (Point) : (Point) - The first point
p2 (Point) : (Point) - The second point
p3 (Point) : (Point) - The third point
Returns: (float) - The growth factor
method to_chart_point(point)
Convert Point to chart.point using chart.point.from_index(safeindex(point.x), point.y)
Namespace types: Point
Parameters:
point (Point) : (Point) - The point to convert
Returns: (chart.point) - The chart.point representation of the input point
method plotline(p1, p2, col, width)
Draw a line from p1 to p2
Namespace types: Point
Parameters:
p1 (Point) : (Point) First point
p2 (Point) : (Point) Second point
col (color)
width (int)
Returns: (line) Line object
method drawlines(points, col, ignore_boundary)
Draw lines between points in an array
Namespace types: array
Parameters:
points (array) : (array) The array of points
col (color) : (color) The color of the lines
ignore_boundary (bool) : (bool) The color of the lines
method to_chart_points(points)
Draw an array of points as chart points on the chart with line.new(chartpoint1, chartpoint2, color=linecolor)
Namespace types: array
Parameters:
points (array) : (array) - The points to draw
Returns: (array) The array of chart points
polygon_area(points)
Calculate the area of a polygon defined by an array of points
Parameters:
points (array) : (array) The array of points representing the polygon vertices
Returns: (float) The area of the polygon
polygon_perimeter(points)
Calculate the perimeter of a polygon
Parameters:
points (array) : (array) Array of points defining the polygon
Returns: (float) Perimeter of the polygon
is_point_in_polygon(point, _polygon)
Check if a point is inside a polygon
Parameters:
point (Point) : (Point) The point to check
_polygon (array)
Returns: (bool) True if the point is inside the polygon, false otherwise
method perimeter(points)
Calculates the convex hull perimeter of a set of points
Namespace types: array
Parameters:
points (array) : (array) The array of points
Returns: (array) The array of points forming the convex hull perimeter
Point
A Point, can be used for vector, floating calcs, etc. Use the cp method for plots
Fields:
x (series float) : (float) The x-coordinate
y (series float) : (float) The y-coordinate
a (series float) : (float) An Angle storage spot
v (series float) : (float) A Value
Line
Line
Fields:
point (Point) : (Point) The starting point of the line
slope (series float) : (float) The slope of the line
GOMTRY.
